







- Amazon Raises Fulfillment Fees Twice, Yet the Median Platform Fee Remains Around 40%Oct 22, 2026View details
- AliExpress and YouTube Partner to Expand Marketing Opportunities for Chinese Brands Going GlobalOct 22, 2026View details
- Publicis says AI marketing is developing at two speeds, with agentic AI helping win clientsOct 21, 2026View details
- Salesforce Plans to Acquire Braze for $5.66 Billion to Enhance AI Marketing CapabilitiesOct 21, 2026View details
- Levanta’s Inaugural China Summit Held in Shenzhen, Focusing on AI and Cross-Border Brand GrowthOct 20, 2026View details
- The October Edition of the 2026 GGE Shenzhen Cross-Border E-Commerce Expo OpensOct 20, 2026View details
Is a 3.2% CTR considered good for ads in Germany?
A 3.2% CTR for ads in Germany indicates that the ads are generating some click response, but it is not enough to determine whether the campaign is performing well. For an export business seeking leads, a 3.2% CTR has business value only if those clicks generate qualified leads at an acceptable cost. If clicks are concentrated on irrelevant search terms, or users take no further action after landing on the website, even a higher CTR may not justify increasing the budget.
Evaluate it in this order: first confirm how the 3.2% was calculated, then examine who is clicking, and finally check landing-page conversions and the cost per qualified inquiry. Germany is the target market, but that alone is not a benchmark for judging CTR.
First, clarify: What type of ad does this 3.2% come from?
Google Search ads, display ads, and Facebook ads reach users in different states of mind. Search ads respond to needs users have actively expressed, while display and social ads may attract attention as people browse content. Comparing their CTRs side by side can easily lead to the wrong conclusion.
Even within search ads, branded and non-branded terms should be assessed separately. People searching for a company name may already know the brand, while those searching for an equipment model or a machining service may still be evaluating suppliers. If branded terms account for a larger share of an account’s traffic, its overall CTR may rise—but that does not mean it has become better at attracting new customers.
For social ads, also check how “clicks” are defined. The total click-through rate, which may include interactions, means something different from the link click-through rate for clicks that lead to a website. Although both reports may show 3.2%, the actual number of people who visit the website may differ considerably.
Before evaluating this figure, at a minimum, confirm the following:
- Are the channel, ad type, and click measurement consistent?
- Are branded and non-branded terms, as well as new-customer and remarketing traffic, reported separately?
- Are the reporting period, devices, and geographic scope comparable?
- Are there enough impressions and clicks to support a conclusion, and could short-term fluctuations be affecting the results?
If the report provides only an overall CTR for the account, first ask for a breakdown. More useful comparisons include your own historical performance under similar conditions and ad groups with similar objectives during the same period. An “average CTR in Germany” that does not specify the industry, channel, or measurement method is of little use in making budget decisions.
Translate CTR into cost per qualified inquiry
CTR shows how many people click after seeing an ad, but the costs a business pays and the leads it gains come later in the process. For B2B campaigns, a more useful measurement chain is: impressions, clicks, website visits, inquiry submissions, and qualified inquiries. Users may drop off at every step, and each step can affect the final cost.
Here is an example using hypothetical figures. An ad receives 10,000 impressions with a CTR of 3.2%, generating 320 clicks. If the average cost per click is 2 euros, the total spend is 640 euros. The landing page generates 8 inquiries, 4 of which match the company’s products, purchasing needs, and service scope. The cost per qualified inquiry is therefore 160 euros.
Another ad also receives 10,000 impressions, but its CTR is only 2%, generating 200 clicks. Assuming the cost per click is still 2 euros, the total spend is 400 euros. If it ultimately generates 5 qualified inquiries, the cost per inquiry is 80 euros. The second ad has a lower CTR, but may be more deserving of the budget.

These figures are for illustration only and are not a cost benchmark for the German market. They show a straightforward relationship: Cost per qualified inquiry = advertising spend ÷ number of qualified inquiries. To determine whether a 3.2% CTR is performing well, you have to look further down the funnel; clicks alone are not enough.
Sales and marketing should also agree on what counts as “qualified.” Potential buyers who can be contacted and have a clear product requirement should be recorded separately from job seekers, sales pitches, and spam submissions. For industrial products with longer sales cycles, you can also track quoting opportunities and subsequent sales rather than evaluating campaigns solely by the number of form submissions.
Whether the cost is acceptable depends on factors such as order gross margin, inquiry-to-sale rate, and sales follow-up costs. Without this business context, it is not possible to set a single acceptable threshold for every company.
After 3.2%, what should you improve next: the ads or the website?
If the CTR reaches 3.2% but inquiries are scarce, first check whether the traffic is relevant. For search ads, review the actual search terms that triggered the ads and check whether users are looking for tutorials, job information, free resources, or products the company does not offer. Also verify the geographic settings: does the actual traffic come from locations that match your target customers and business scope in Germany?
If the traffic is relevant, check the landing page. If an ad promises a particular type of equipment or custom service but sends users to a broad company homepage, they have to find the product themselves, which can hurt conversion. The page linked from a German-language ad should help users quickly find product specifications, application requirements, delivery information, and contact options. Localization should cover technical language and purchasing information, not just navigation labels.
Test mobile loading, form submission, and whether the confirmation after submission is clear. B2B buyers may need to upload drawings or explain technical requirements, so the form should support the necessary information while avoiding excessive, irrelevant fields at the first point of contact.
Also check the tracking process. An ad click does not mean the page loaded successfully, and a form submission does not mean sales received the lead. Website analytics, ad conversion records, and customer management records may differ because of measurement methods, user consent settings, or duplicate events. Rule out missing and duplicate records first; only then can you determine whether the issue lies with the ads or the website.
Decide on next steps based on the results:
- Cost per qualified inquiry is acceptable and lead quality is stable: Increase the budget gradually and monitor whether the quality holds as traffic grows.
- There are many clicks, but the search terms or audience are not aligned with the business: Narrow the traffic first by adjusting keywords, exclusions, and ad messaging.
- User needs are a good match, but on-site conversion is weak: Prioritize improving page content, contact paths, and form experience.
When evaluating website development and marketing services, you can also ask the service provider to include this entire process in one report: who the ads attract, which pages those users visit, how many qualified inquiries they submit, and the quality of the leads received by sales. Once these data points are connected, the 3.2% figure becomes easier to interpret, and it becomes easier to decide where to invest the next budget.
Related Articles
 How can you evaluate a landing page agency's conversion tracking capabilities?
 How much does it cost to run Google paid ads in Japan?
 ChatGPT Ads expands to 26 countries and regions, with over 100,000 advertisers


Related Products
 Yiyingbao SaaS Intelligent Website Building and Marketing SystemYiyingbao SaaS Intelligent Website Building and Marketing System, AI-powered no-code website building, rapid creation of multilingual B2B international websites in 10 minutes, global server acceleration, AI-powered SEO optimization, helping businesses connect efficiently with global markets. The perfect integration of technology and operation makes building an international trade website remarkably simple
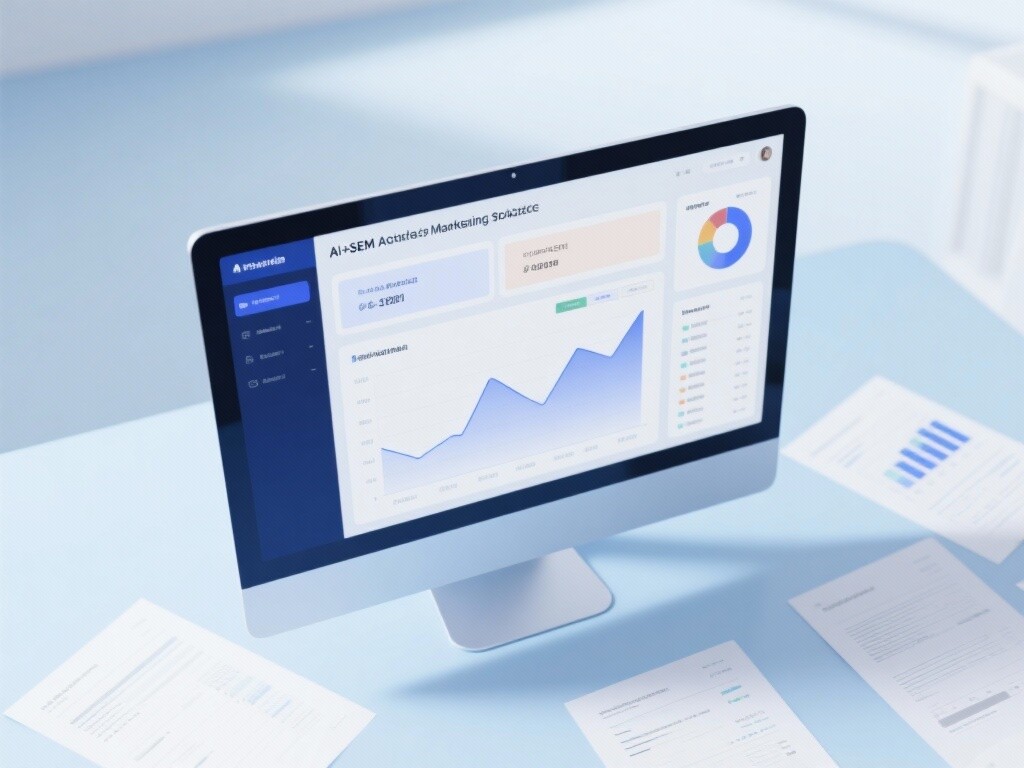
 AI+SEM Intelligent Advertising Marketing SystemAI+SEM drives intelligent ad creation, empowering full-funnel precision advertising marketing. The system automatically generates weekly/monthly reports, AI recommends keywords and target countries, monitors core metrics in real-time with intelligent alerts, and enables one-click high-conversion ad solutions to help quickly acquire customers and improve ROI.
 AI+SEO Dual-Engine System Optimization ServicesYiyingbao’s AI+SEO dual-engine optimization system helps foreign trade enterprises acquire high-quality organic traffic through AI-powered keyword research, content generation, and comprehensive technical optimization, significantly improving search rankings and conversion rates.
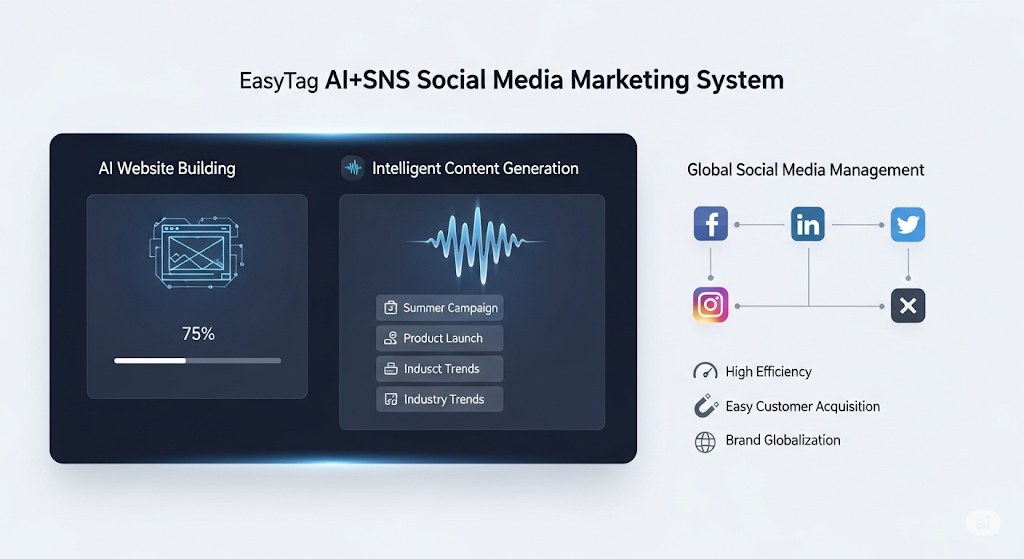
 AI+SNS Social Media Marketing SystemYingbao AI+SNS Social Media Marketing System - Precision social capture for the social media era. Supports one-click content synchronization across major platforms like Facebook and LinkedIn. AI intelligently rewrites posts for enhanced relevance. 24/7 AI customer service and user profiling analysis empower businesses to efficiently expand into global markets.
 AI+SEO营销解决方案易营宝AI+SEO营销解决方案,通过AI批量写作、智能生成TDK、精准关键词扩词等功能,全面优化网站SEO效果,提升流量与转化率。助力企业构建高效智能网站新生态。
 AI+SEM Advertising Marketing SolutionsAI+SEM Advertising Marketing Solution leverages AI technology to deeply empower SEM ad campaigns. It automatically generates weekly/monthly reports using AI, presenting account data across multiple dimensions for comprehensive insights into campaign performance and trends. The system precisely recommends keywords and target countries, intelligently generates high-conversion ad copy, and enables one-click activation of efficient campaign plans to help businesses rapidly acquire customers. Simultaneously, it monitors core metrics in real time, intelligently identifies abnormal fluctuations, and issues timely alerts to ensure stable, high-return advertising results.
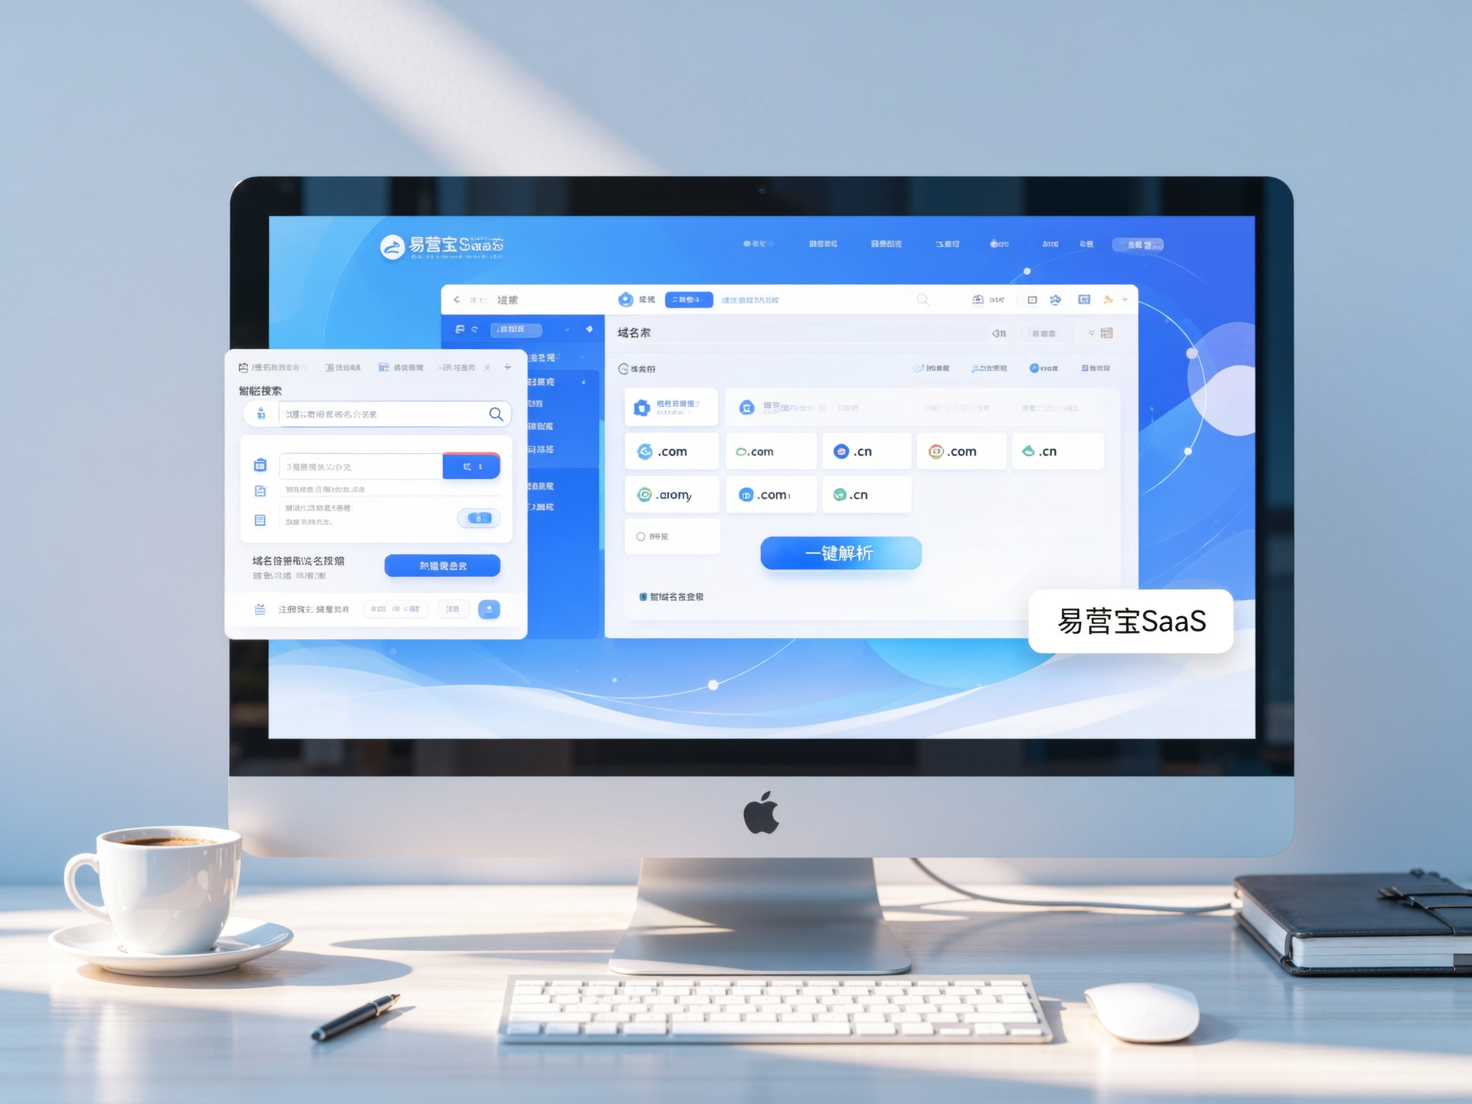
 Domain Name ServicesEasyWin provides professional domain name services, including intelligent queries, one-stop registration, brand protection, and full lifecycle management, helping businesses build a digital brand image.
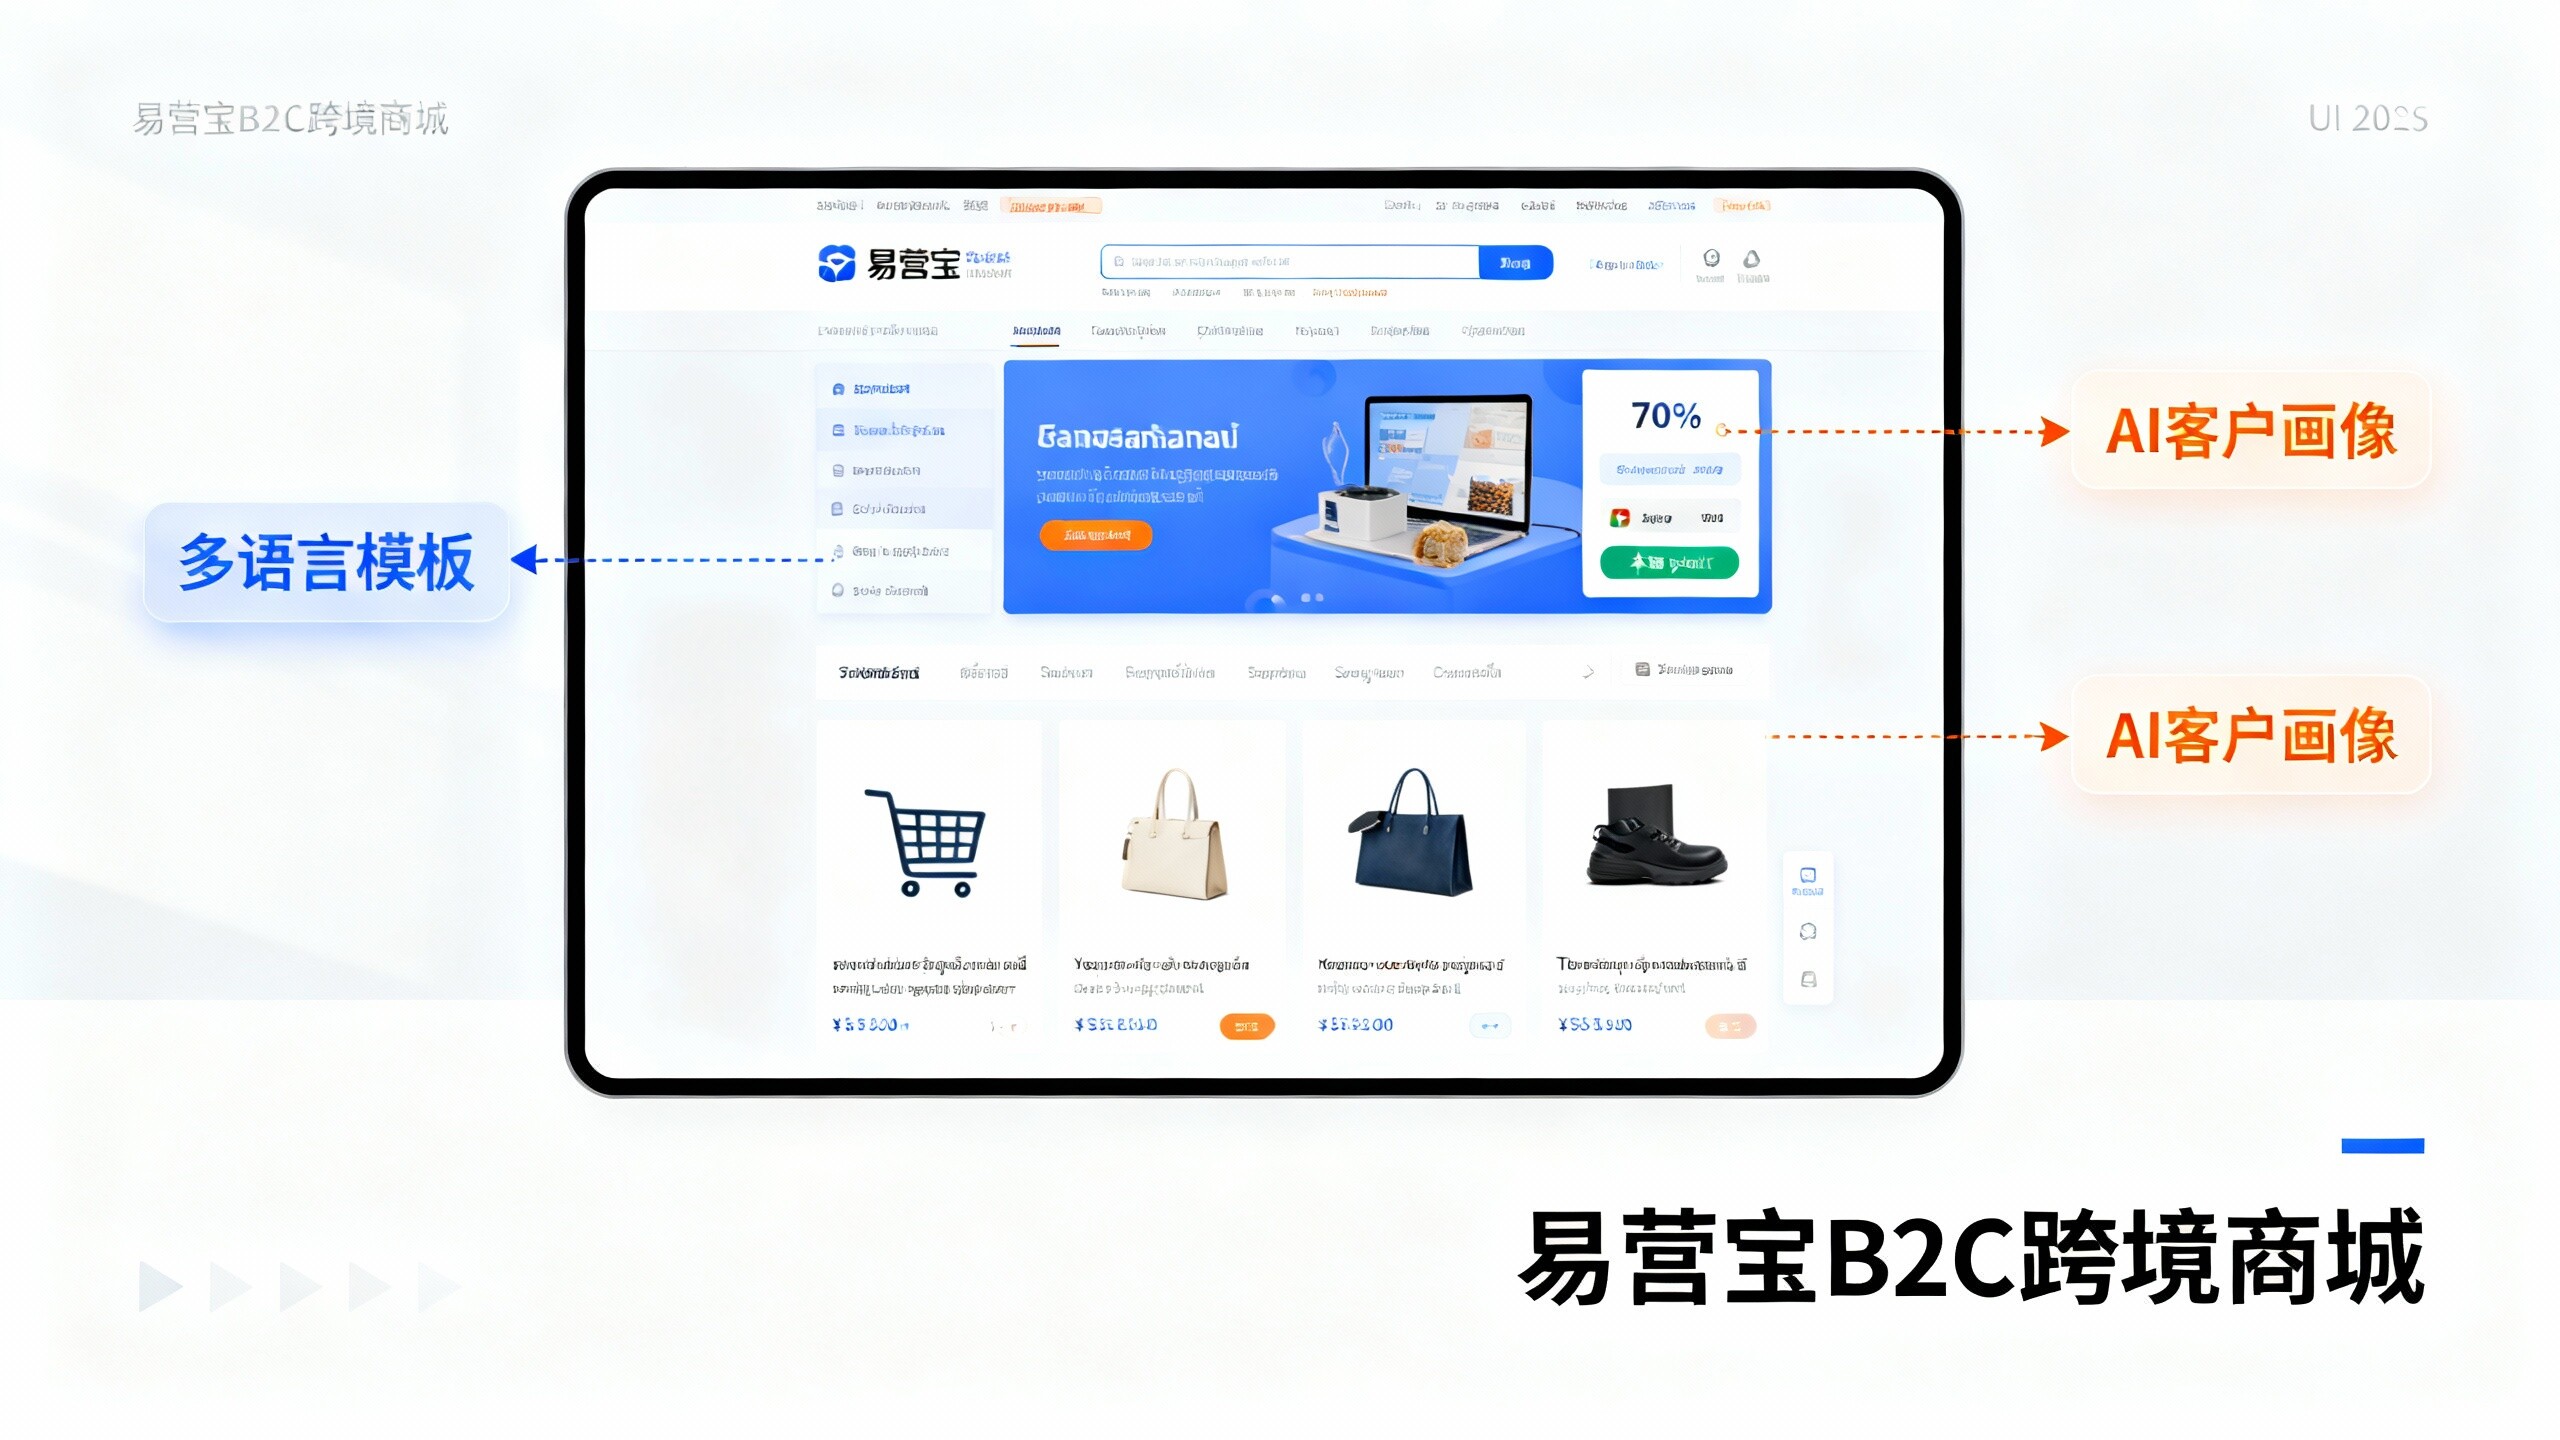
 EasyOperate B2C Cross-Border E-Commerce Platform & Independent WebsiteEasyStore B2C Cross-border E-commerce Independent Store is an intelligent website building and cross-border e-commerce integrated solution independently developed by EasyStore Information Technology (Beijing) Co., Ltd. The system is specially designed for small and medium-sized as well as large export enterprises, integrating 'website building, operation, marketing, advertising, and conversion' into one, helping enterprises quickly establish cross-border e-commerce independent stores to achieve brand globalization and global sales growth.
The platform supports multiple languages, multiple currencies, and multi-channel marketing, with built-in AI intelligent translation and SEO optimization systems, suitable for mainstream markets such as Southeast Asia, Europe and America, Latin America, and the Middle East, assisting Chinese manufacturing enterprises in efficiently deploying international e-commerce strategies. SSL证书易营宝提供专业SSL安全证书服务,包括单域名和泛域名证书,确保网站数据传输加密、身份验证和完整性保护,助力企业建立安全可信的在线业务环境。