








- Which customer acquisition channels will be affected by cross-border marketing trends in 2026?Sep 06, 2026View details
- Which homogenization risks should be considered in an analysis of the AI-powered website building industry?Aug 30, 2026View details
- How Will AI Marketing Trends 2026 Change Advertising Budget AllocationAug 28, 2026View details
- Is the EV SSL certificate market shrinking or upgrading? How should companies assess certificate procurement?Aug 11, 2026View details
- Why the old AMP SEO 2020 practices no longer work and what has changed in current optimization prioritiesAug 02, 2026View details
- How to Choose Topics for an Industry News Section to Attract More Organic Search TrafficJul 29, 2026View details
How to Create an International Social Media Operations Data Report? Key Metrics, Attribution Criteria, and Reporting Template Suggestions
When building a data report for overseas social media operations, the real challenge is usually not the spreadsheet itself, but whether the data can answer business questions. In an integrated website and marketing scenario, social media content, ad campaigns, independent website visits, and inquiry conversions often happen at the same time. If the measurement standards are not unified, the report can easily become a pile of numbers that looks “busy but useless”.
A truly valuable data report for overseas social media operations should connect platform performance, on-site behavior, lead quality, and advertising costs. The purpose is not only to make weekly and monthly reporting easier, but also to determine whether the content strategy is effective, whether the channel budget is reasonable, and where the next round of optimization should start.
First clarify which decisions the report should support

Many teams start pulling data as the first step when creating a data report for overseas social media operations, and the report becomes increasingly complicated as a result. A more reliable approach is to work backward from the conclusions needed by management, the operations team, and the sales team respectively, and then decide which metrics should be retained.
If the focus is brand exposure, the report should track reach, impression frequency, engagement rate, and follower growth quality. If the goal is customer acquisition, clicks, landing page visits, form submissions, direct message inquiries, qualified inquiries, and deal opportunities must be placed into the same funnel.
Especially in the scenario of taking an independent website overseas, social media is no longer just about “posting content”. It often works together with multilingual websites, advertising landing pages, and search traffic. Therefore, a data report for overseas social media operations should not stop at the platform backend, but should extend to on-site conversions.
Core metrics do not need to be numerous, but they must form a system
An actionable data report for overseas social media operations can usually be divided into four layers: the exposure layer, the engagement layer, the traffic acquisition layer, and the conversion layer. Only when the layers are clearly defined can the data become interpretable.
Platform performance metrics
- Impressions: how many times the content was viewed, suitable for evaluating distribution capability.
- Reach: how many unique accounts were actually reached, making it easier to control duplicate exposure.
- Engagements: the total of likes, comments, saves, shares, reposts, and other interactions.
- Engagement rate: used to evaluate content appeal, and more valuable than engagement volume alone.
Traffic acquisition and on-site behavior metrics
- Link clicks: whether the content can turn interest into visits.
- Website sessions: the real traffic volume after users enter the website.
- Bounce rate and time on site: important signals of landing page relevance.
- Key page visits: whether product pages, inquiry pages, and quotation pages have been viewed.
Conversion and quality metrics
- Form submissions or direct messages: the most direct lead output.
- Qualified inquiry rate: closer to real value after filtering out invalid traffic.
- Cost per lead: the basis for comparing efficiency across different platforms, content, and ad groups.
- Revenue contribution: suitable for monthly and quarterly reviews, and not recommended for overly short-term evaluation.
For integrated website + marketing service operations, landing page loading speed, device distribution, geographic distribution, and language version performance should also be included. This is because poor social media data is often not caused by weak content, but by problems in the page experience after the click.
If attribution standards are inconsistent, the report becomes difficult to review
The most common dispute in a data report for overseas social media operations is not whether a metric is high or low, but who should be responsible for the result. A social media platform may show a lot of engagement, while website analytics tools cannot see the corresponding conversions. This situation is mostly caused by inconsistent attribution standards.
At least three common standards should be clarified in advance: the conversion attribution window, channel identification rules, and statistical deduplication method. Without these explanations, different departments may draw different conclusions from the same report.
In actual execution, standardized link parameters are critical. Content posts, ad creatives, influencer collaborations, and short video traffic acquisition should ideally follow unified naming rules. Only in this way can a data report for overseas social media operations trace results back to specific content, specific campaigns, and specific pages.
It is recommended to design the report structure as “dashboard + analysis pages”
The reporting template does not need to be overly heavy from the beginning. In most cases, a high-quality data report for overseas social media operations consisting of a homepage dashboard and subsequent analysis pages is already enough to support weekly and monthly reporting.
The homepage dashboard focuses on results
It is recommended to include the core conclusions for the current period, key anomalies, main growth sources, and issues requiring action. The numbers do not need to be excessive, but they must be understandable at a glance. For example: which platform brought more qualified visits, which content series had a higher inquiry rate, and which region had significantly higher conversion costs.
Analysis pages explain the reasons
Analysis pages can be broken down by platform, content type, region, language, landing page, and advertising campaign. The benefit is that the data report for overseas social media operations not only reports “what happened”, but also explains “why it happened”.
- Weekly reports are more suitable for tracking fluctuations, anomalies, and short-term optimization actions.
- Monthly reports are more suitable for reviewing trends, cost structures, and channel contribution.
- Quarterly reviews should further examine lead quality and the relationship with closed deals.
If the business simultaneously covers website building, SEO, advertising, and social media, the report should ideally connect to a unified data view. Platforms like 易营宝, which integrate intelligent website building, overseas marketing, advertising systems, and optimization capabilities, have the advantage of placing on-site conversions and off-site campaigns within the same analysis framework, reducing data fragmentation.
Different business scenarios require different areas of focus
Even for the same type of data report for overseas social media operations, the priorities can vary greatly across different overseas business models. If the reporting template is completely unified, it often hides the real issues.
In other words, a data report for overseas social media operations is not a fixed template to be copied, but a set of choices made around business objectives. Templates can be standardized, but judgment must not become mechanical.
Several details that make reports truly useful
First, retain month-over-month and year-over-year comparisons. Looking only at absolute values makes it difficult to judge whether fluctuations are normal. Second, write down explanations for anomalies, such as platform activities, holiday timing, budget adjustments, page revisions, and similar factors, to avoid misinterpretation later.
Third, set alert thresholds for each core metric. For example, when the click-through rate is below a certain value, the bounce rate is above a certain value, or the cost per lead exceeds the budget, the report can shift from a “recording tool” to a “management tool”.
Fourth, place recommended actions next to the data. The biggest problem with a data report for overseas social media operations is having conclusions without actions. If a piece of content has high clicks but low conversions, the next step should be to check the landing page information, form length, page loading speed, and regional relevance, instead of stopping at “average performance”.
From one report to continuous optimization
The ultimate purpose of creating a data report for overseas social media operations is not to make the data look more polished, but to create a closed loop among content, channels, the website, and sales follow-up. Platform data answers “was it seen”, on-site data answers “was the user persuaded”, and conversion data shows “whether business value was created”.
If the current report is still at the stage of screenshot summaries or manual assembly, the next step can start with three things: unify channel naming, define conversion standards, and build a fixed weekly and monthly report structure. Once the foundation is stable, more complete website and marketing collaboration data can be connected gradually.
When a data report for overseas social media operations can consistently answer “which type of content works, which traffic is worth investing in, and which page is holding performance back”, it truly has decision-making value. Whether the next step is optimizing an independent website, adjusting the social media rhythm, or evaluating an integrated marketing solution, decisions will become more evidence-based.
Related Articles



Related Products
 Yiyingbao SaaS Intelligent Website Building and Marketing SystemYiyingbao SaaS Intelligent Website Building and Marketing System, AI-powered no-code website building, rapid creation of multilingual B2B international websites in 10 minutes, global server acceleration, AI-powered SEO optimization, helping businesses connect efficiently with global markets. The perfect integration of technology and operation makes building an international trade website remarkably simple
 AI+SEM Intelligent Advertising Marketing SystemAI+SEM drives intelligent ad creation, empowering full-funnel precision advertising marketing. The system automatically generates weekly/monthly reports, AI recommends keywords and target countries, monitors core metrics in real-time with intelligent alerts, and enables one-click high-conversion ad solutions to help quickly acquire customers and improve ROI.
 AI+SEO Dual-Engine System Optimization ServicesYiyingbao’s AI+SEO dual-engine optimization system helps foreign trade enterprises acquire high-quality organic traffic through AI-powered keyword research, content generation, and comprehensive technical optimization, significantly improving search rankings and conversion rates.
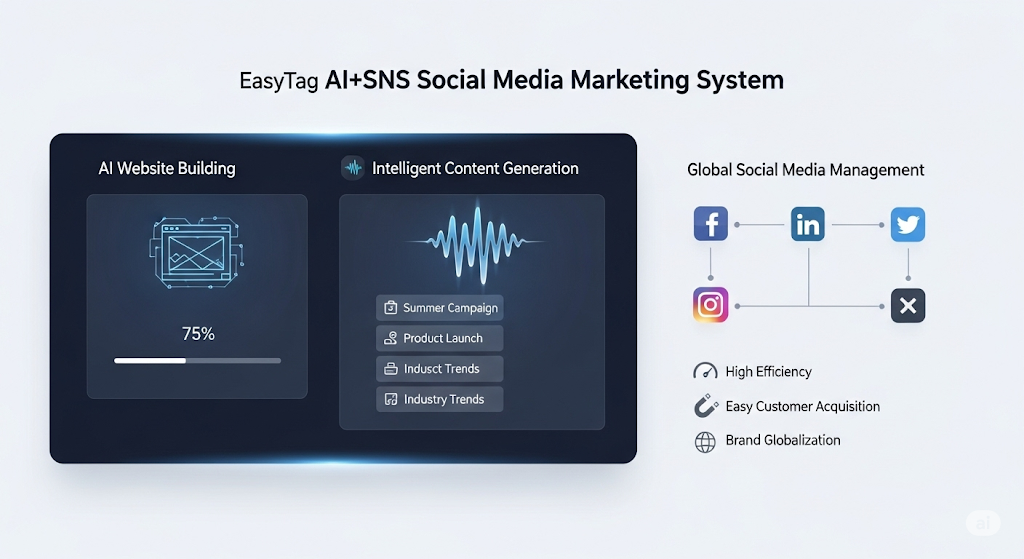
 AI+SNS Social Media Marketing SystemYingbao AI+SNS Social Media Marketing System - Precision social capture for the social media era. Supports one-click content synchronization across major platforms like Facebook and LinkedIn. AI intelligently rewrites posts for enhanced relevance. 24/7 AI customer service and user profiling analysis empower businesses to efficiently expand into global markets.
 AI+SEO营销解决方案易营宝AI+SEO营销解决方案,通过AI批量写作、智能生成TDK、精准关键词扩词等功能,全面优化网站SEO效果,提升流量与转化率。助力企业构建高效智能网站新生态。
 AI+SEM Advertising Marketing SolutionsAI+SEM Advertising Marketing Solution leverages AI technology to deeply empower SEM ad campaigns. It automatically generates weekly/monthly reports using AI, presenting account data across multiple dimensions for comprehensive insights into campaign performance and trends. The system precisely recommends keywords and target countries, intelligently generates high-conversion ad copy, and enables one-click activation of efficient campaign plans to help businesses rapidly acquire customers. Simultaneously, it monitors core metrics in real time, intelligently identifies abnormal fluctuations, and issues timely alerts to ensure stable, high-return advertising results.
 Domain Name ServicesEasyWin provides professional domain name services, including intelligent queries, one-stop registration, brand protection, and full lifecycle management, helping businesses build a digital brand image.
 EasyOperate B2C Cross-Border E-Commerce Platform & Independent WebsiteEasyStore B2C Cross-border E-commerce Independent Store is an intelligent website building and cross-border e-commerce integrated solution independently developed by EasyStore Information Technology (Beijing) Co., Ltd. The system is specially designed for small and medium-sized as well as large export enterprises, integrating 'website building, operation, marketing, advertising, and conversion' into one, helping enterprises quickly establish cross-border e-commerce independent stores to achieve brand globalization and global sales growth.
The platform supports multiple languages, multiple currencies, and multi-channel marketing, with built-in AI intelligent translation and SEO optimization systems, suitable for mainstream markets such as Southeast Asia, Europe and America, Latin America, and the Middle East, assisting Chinese manufacturing enterprises in efficiently deploying international e-commerce strategies. SSL证书易营宝提供专业SSL安全证书服务,包括单域名和泛域名证书,确保网站数据传输加密、身份验证和完整性保护,助力企业建立安全可信的在线业务环境。