








- Which customer acquisition channels will be affected by cross-border marketing trends in 2026?Sep 06, 2026View details
- Which homogenization risks should be considered in an analysis of the AI-powered website building industry?Aug 30, 2026View details
- How Will AI Marketing Trends 2026 Change Advertising Budget AllocationAug 28, 2026View details
- Is the EV SSL certificate market shrinking or upgrading? How should companies assess certificate procurement?Aug 11, 2026View details
- Why the old AMP SEO 2020 practices no longer work and what has changed in current optimization prioritiesAug 02, 2026View details
- How to Choose Topics for an Industry News Section to Attract More Organic Search TrafficJul 29, 2026View details
Which Core Metrics Should Be Monitored in Overseas Social Media Operations Reports?
The most common challenge in overseas social media management is not “having no data,” but “having too much data.” Platform dashboards, advertising systems, website analytics tools, and CRMs each have their own set of figures. Daily, weekly, and monthly reports become increasingly lengthy, yet when a problem actually arises, it is still difficult to tell whether the issue lies with the content, the traffic quality, or the website’s ability to capture conversions.
Therefore, the focus of an overseas social media operations report should not be on listing every metric, but on tracking a few core indicators that reflect the health of the entire journey. For companies focused on inquiry generation, independent website traffic acquisition, and brand exposure, social media is never an isolated activity. It must be evaluated together with website conversion, advertising, SEO planning, and sales follow-up. If a report only looks at likes and followers, the conclusions are often biased.
Don’t Rush to Look at the “Buzz Metrics”
When many teams prepare overseas social media operations reports, the first things they look at are views, likes, and follower growth. These metrics are not useless, but they are more like “surface-level vital signs.” They can indicate whether the content has been seen, but they cannot directly show whether it has generated meaningful business results. Especially in B2B scenarios, good engagement on a post does not necessarily mean that it will generate an inquiry. Conversely, a professional post with average engagement may attract more precise buyers.
A more practical issue is that engagement mechanisms vary greatly across platforms. The distribution logic, user behavior, and conversion paths of Facebook, LinkedIn, Instagram, YouTube, and TikTok are not the same. If data from all platforms is simply added together in a report, it is easy to reach incorrect conclusions. When reviewing a report, the first step is to clarify the objective: are you currently building brand awareness, acquiring leads, or supporting advertising-based landing-page conversions? Different objectives require different priorities for core metrics.
What You Really Need to Track Is Not One Metric, but an Entire Journey
One practical approach is to divide a social media report into four levels: exposure, engagement, traffic acquisition, and conversion. If only the most critical indicators for each level are retained, the report becomes much clearer.
Exposure: Is the Content Being Seen by the Target Market?
At the exposure level, the most important metrics are impressions, reach, and the geographic coverage of the content. High impressions only show that the platform distributed the content. Reach provides a clearer view of how many real users encountered it. If your overseas business focuses on North America or the Middle East, but most of the reach comes from non-target regions, even an attractive report has limited significance.
Another frequently overlooked point is that organic exposure and paid exposure should be analyzed separately. When they are mixed together, teams may mistakenly assume that their content capabilities have improved, when in fact the results have simply been driven up by advertising budgets. During long-term operations, it is essential to understand whether the results come from the content itself or from paid promotion.
Engagement: Has the User Shown Genuine Interest?
At the engagement level, it is not advisable to look only at total likes. More useful indicators include engagement rate, saves, shares, comment quality, and proactive inquiries made through direct messages or forms. For B2B companies, comments such as “How should I choose the specifications?”, “Can this be customized?”, and “What is the lead time?” are often more valuable than dozens of generic likes.
If video content accounts for a significant proportion of your output, completion rate and retention during the first few seconds should also be reviewed. The problem with many pieces of content is not the topic, but the slow opening and low information density, which means users never reach the later selling points. A low completion rate usually requires a review of the content structure itself, rather than blindly increasing the budget.
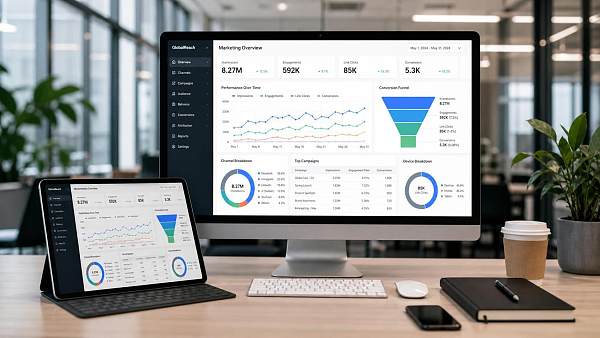
Traffic Acquisition: Is Social Media Sending People Where They Need to Go?
Social media truly connects with business results after the click. Therefore, clicks, link click-through rate, landing-page visits, and session quality are essential elements to monitor in an overseas social media operations report. In particular, link click-through rate can show whether the content has successfully turned interest into action.
However, seeing clicks is not enough. Many teams have encountered the following situation: social media generates a considerable number of clicks, but the time spent on the website is very short and the bounce rate is high. The problem may not be on the social media side. It could be caused by unnatural landing-page language, slow loading speed, a poor mobile experience, or inconsistency between the content promise and the information on the page. In other words, if a social media report is not reviewed together with website data, it is easy to make an incorrect judgment.
This is also why the “website + integrated marketing services” approach is becoming increasingly important. After social media brings in traffic, the website must be able to capture it. For an integrated service provider such as 易营宝, which covers intelligent website building, SEO, advertising, and overseas social media operations, the value lies not merely in offering more tools, but in being able to evaluate front-end traffic acquisition and back-end conversion within the same growth journey. For operators, this means that reports no longer stop at platform dashboards, but can show a more complete user path.
Conversion: Have Effective Inquiries Been Generated, Rather Than Just “Empty Buzz”?
At the conversion level, at least three things should be monitored: the number of form submissions or direct messages, the rate of valid inquiries, and the cost per conversion. The word “valid” is especially important. Anyone involved in foreign trade and global business knows that an inquiry does not automatically equal a sales opportunity. Spam leads, low-intent inquiries, and traffic from non-target countries can all inflate the surface-level figures in a report.
Therefore, a mature overseas social media operations report should not stop at the “number of leads acquired.” It should also look further along the journey, including the page where the inquiry originated, the country where the inquiry came from, the quality of the initial communication, and even the lead rating assigned by sales. Without this information, it is difficult for the operations team to know whether it is bringing in the right customers.
Several Key Evaluation Points That Are Easily Overlooked in Reports
The first is the geographic and language dimension. Overseas markets vary significantly. The same content may perform completely differently in Europe and the United States, Southeast Asia, and Latin America. If multilingual accounts only look at the overall figures without breaking down the results by language version, the direction of optimization will be extremely unclear.
The second is the content-type dimension. Short videos, carousel posts, industry insights, customer scenarios, product details, and factory capabilities serve different purposes. All content cannot be evaluated using the same standard. For example, brand-awareness content should focus on reach and engagement, while landing-page traffic content should focus more on clicks and subsequent conversions.
The third is the time dimension. Weekly reports are suitable for identifying anomalies, monthly reports are suitable for evaluating trends, and a single viral post should not be used to define a strategy directly. Many account problems are not caused by content suddenly becoming ineffective, but by inconsistent publishing rhythms, insufficient advertising tests, or delayed website conversion support. These issues can only be identified by examining a longer period.
A Practical Report Should Ideally Answer These Questions
At the Operational Level, Reports Do Not Need to Be Complex; What Matters Is That They Guide the Next Step
A truly useful report is usually not created as a “data warehouse” piled with figures. What operators need most is to know which types of content deserve more investment this month, which countries’ advertising should be scaled back, which landing pages should be redesigned, and which leads should not continue to be amplified.
If a company is still building a coordinated process for its independent website, advertising, SEO, and social media, it is best to standardize the measurement criteria from the beginning. For example, social media links should include tracking parameters, website forms should record the source channel, and the CRM should send lead-quality data back to the system. Otherwise, the front end may show that “conversions are performing well,” while the sales team believes that “the leads are inaccurate,” making it easy for different teams to give conflicting accounts.
From this perspective, an integrated service system such as 易营宝, which has long focused on global digital marketing, offers a useful reference in terms of its approach. Instead of treating website building, SEO, advertising, and social media as separate projects, it configures tools and services around the entire customer-acquisition journey for companies going global. For companies targeting multiple regional markets, including North America, Europe, and Southeast Asia, this integrated approach makes it easier to connect reporting across channels, rather than allowing each channel to generate isolated activity.
Finally, Remember That Metrics Are Used to Diagnose Problems, Not Decorate Results
When it comes to which core metrics an overseas social media operations report should track, the issue is ultimately not about choosing a template, but about making business judgments. Exposure tells you whether you have been seen, engagement tells you whether you have sparked interest, clicks tell you whether you have encouraged action, and conversions tell you whether you are moving closer to a deal. If any part is missing, the judgment may be distorted.
If your report currently looks comprehensive but still cannot answer “where the problem lies,” the issue is usually not that there is too little data, but that the journey has not been connected. The next step worth taking is not to add several more attractive metrics, but to evaluate social media, website performance, and inquiry results from the same perspective. Only then can the report truly guide operations instead of merely serving as an end-of-month formality.
Related Articles



Related Products
 Yiyingbao SaaS Intelligent Website Building and Marketing SystemYiyingbao SaaS Intelligent Website Building and Marketing System, AI-powered no-code website building, rapid creation of multilingual B2B international websites in 10 minutes, global server acceleration, AI-powered SEO optimization, helping businesses connect efficiently with global markets. The perfect integration of technology and operation makes building an international trade website remarkably simple
 AI+SEM Intelligent Advertising Marketing SystemAI+SEM drives intelligent ad creation, empowering full-funnel precision advertising marketing. The system automatically generates weekly/monthly reports, AI recommends keywords and target countries, monitors core metrics in real-time with intelligent alerts, and enables one-click high-conversion ad solutions to help quickly acquire customers and improve ROI.
 AI+SEO Dual-Engine System Optimization ServicesYiyingbao’s AI+SEO dual-engine optimization system helps foreign trade enterprises acquire high-quality organic traffic through AI-powered keyword research, content generation, and comprehensive technical optimization, significantly improving search rankings and conversion rates.
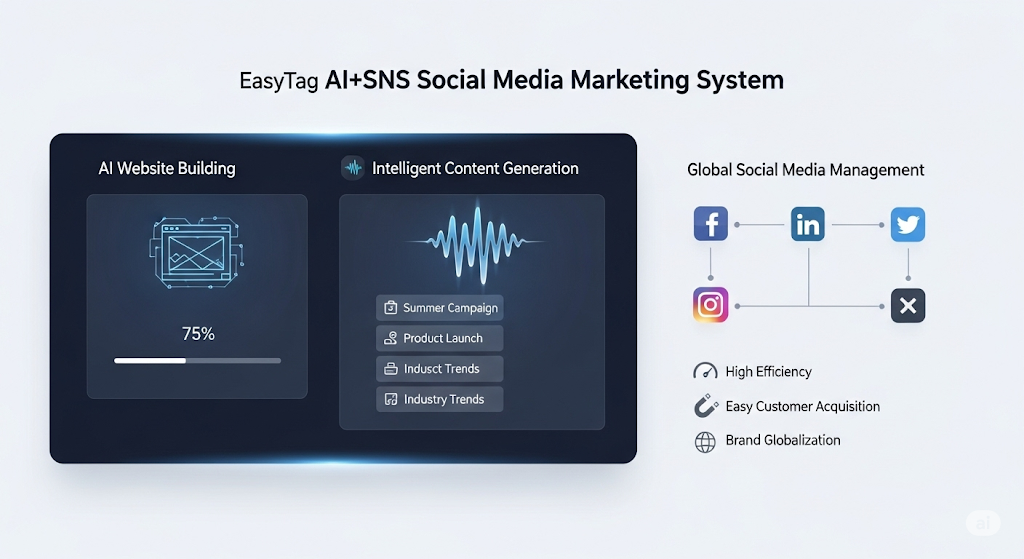
 AI+SNS Social Media Marketing SystemYingbao AI+SNS Social Media Marketing System - Precision social capture for the social media era. Supports one-click content synchronization across major platforms like Facebook and LinkedIn. AI intelligently rewrites posts for enhanced relevance. 24/7 AI customer service and user profiling analysis empower businesses to efficiently expand into global markets.
 AI+SEO营销解决方案易营宝AI+SEO营销解决方案,通过AI批量写作、智能生成TDK、精准关键词扩词等功能,全面优化网站SEO效果,提升流量与转化率。助力企业构建高效智能网站新生态。
 AI+SEM Advertising Marketing SolutionsAI+SEM Advertising Marketing Solution leverages AI technology to deeply empower SEM ad campaigns. It automatically generates weekly/monthly reports using AI, presenting account data across multiple dimensions for comprehensive insights into campaign performance and trends. The system precisely recommends keywords and target countries, intelligently generates high-conversion ad copy, and enables one-click activation of efficient campaign plans to help businesses rapidly acquire customers. Simultaneously, it monitors core metrics in real time, intelligently identifies abnormal fluctuations, and issues timely alerts to ensure stable, high-return advertising results.
 Domain Name ServicesEasyWin provides professional domain name services, including intelligent queries, one-stop registration, brand protection, and full lifecycle management, helping businesses build a digital brand image.
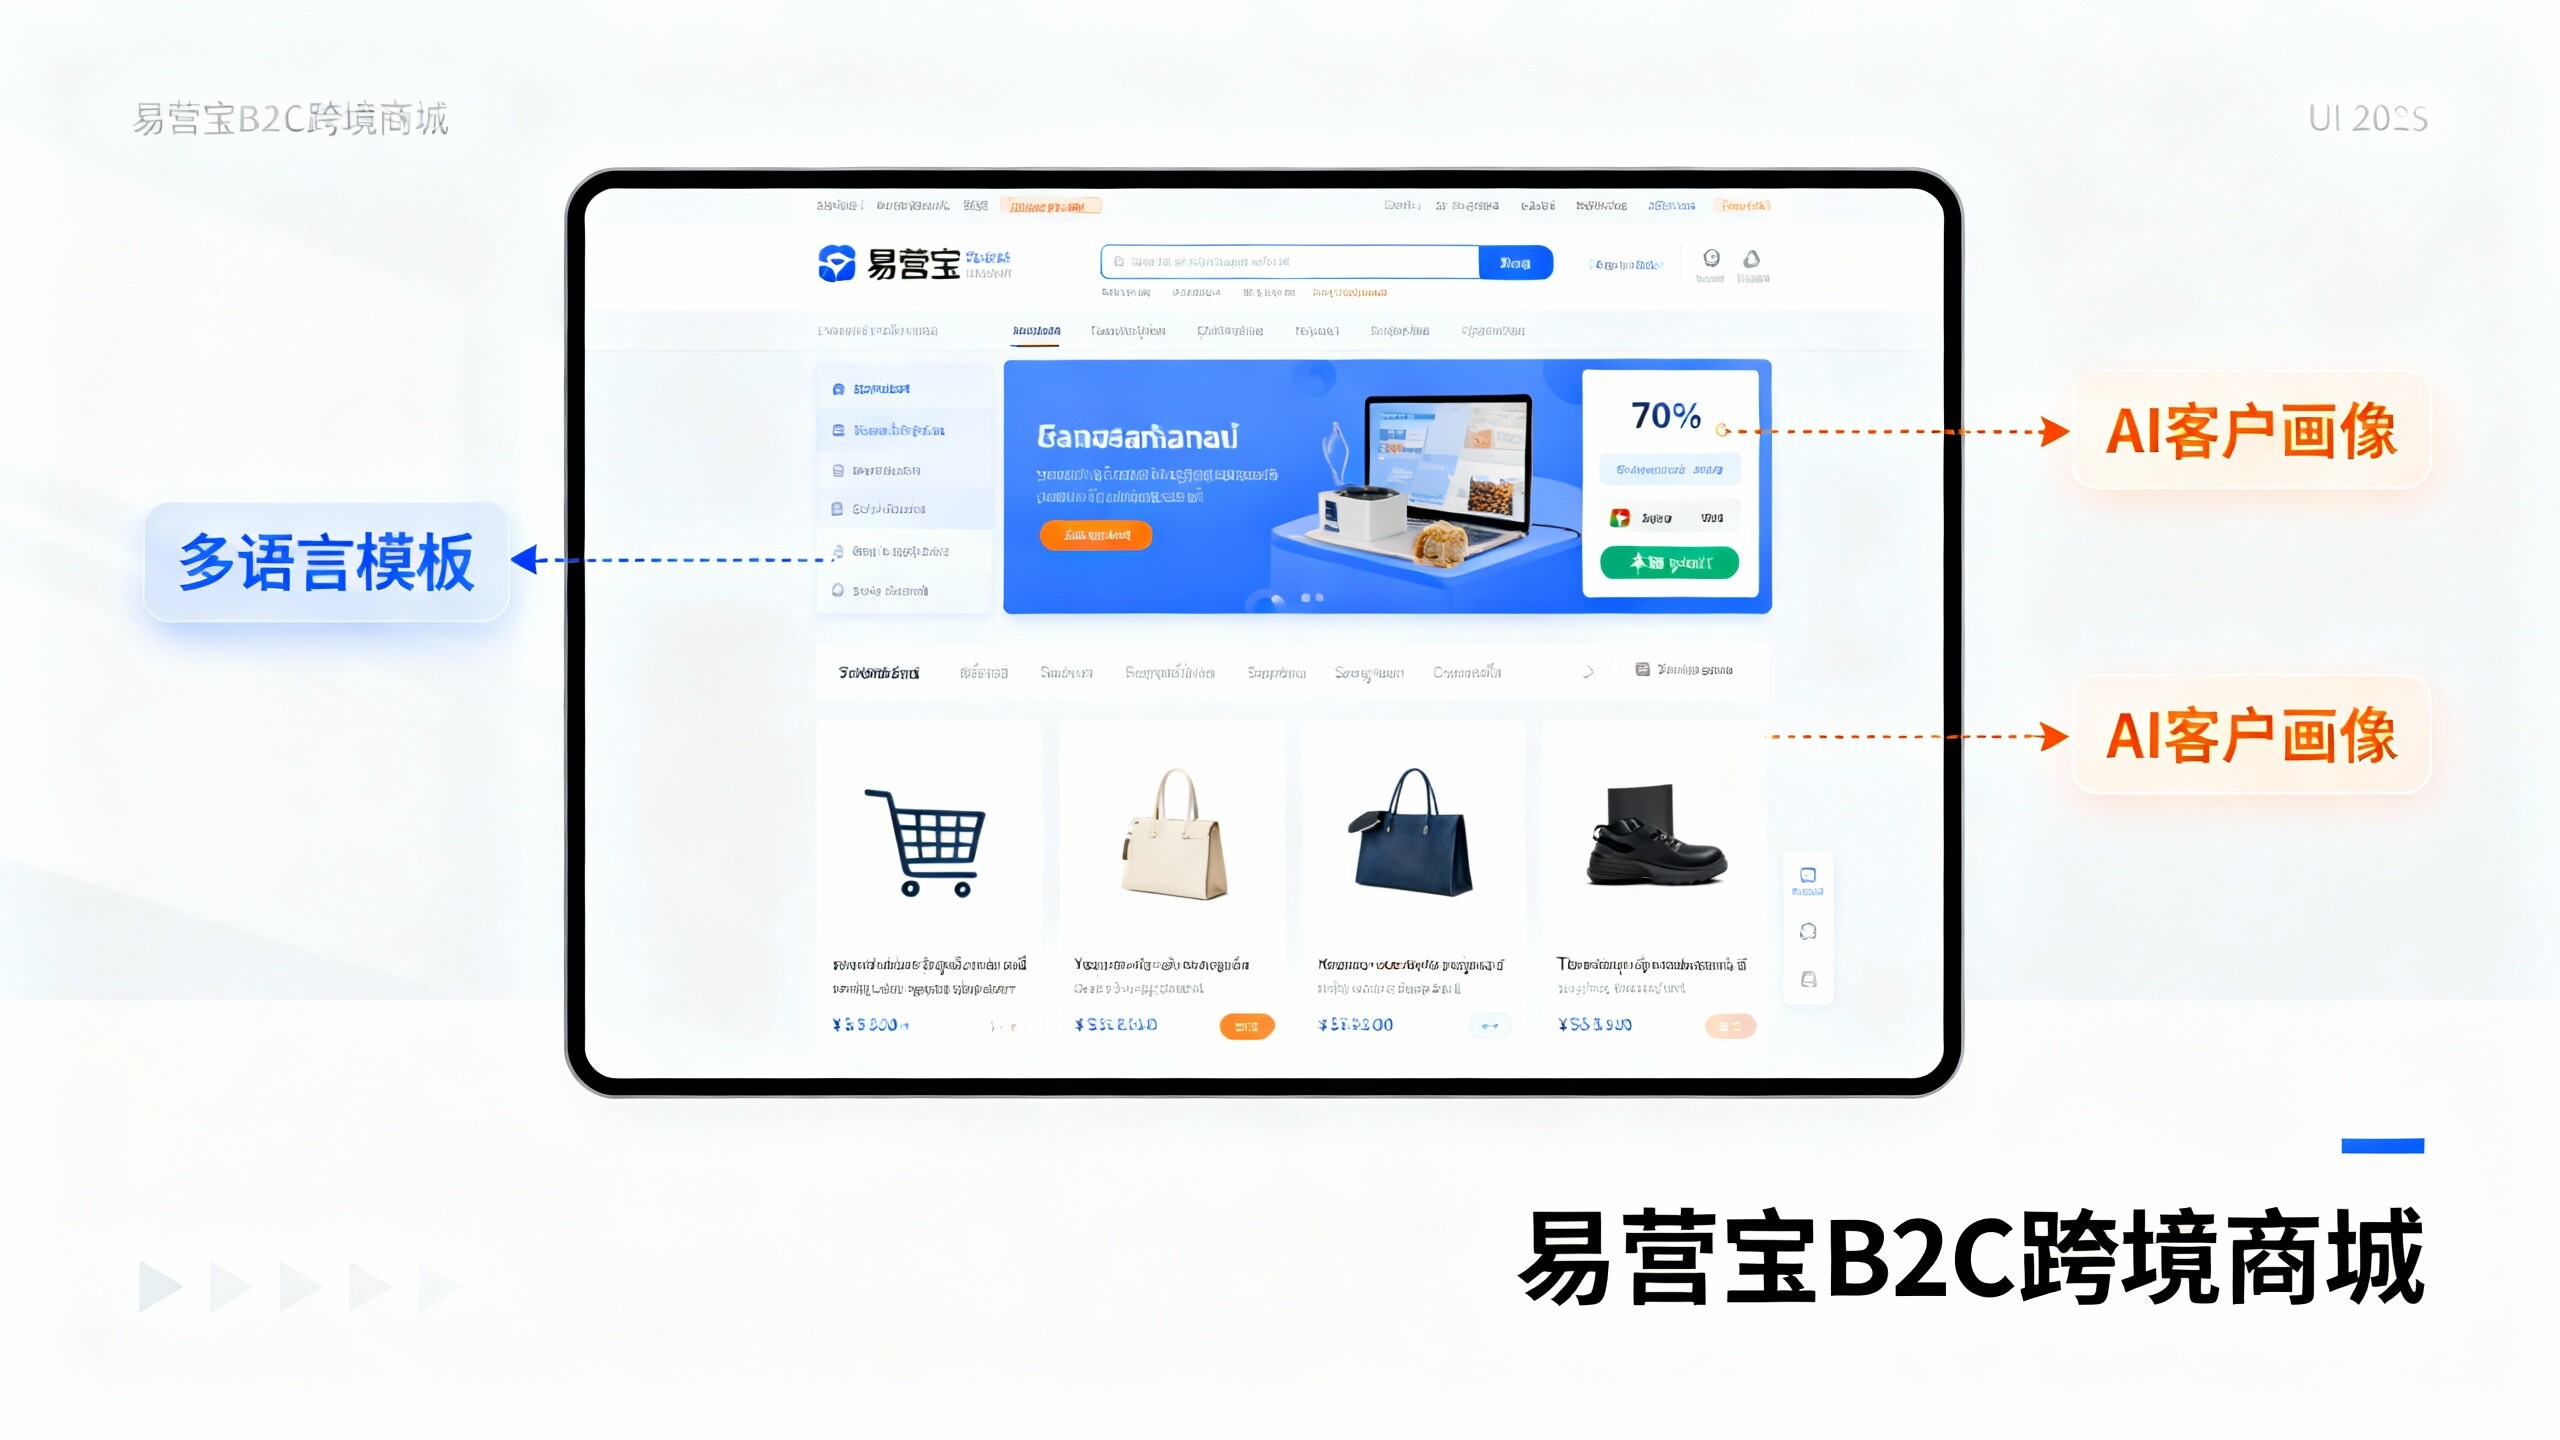
 EasyOperate B2C Cross-Border E-Commerce Platform & Independent WebsiteEasyStore B2C Cross-border E-commerce Independent Store is an intelligent website building and cross-border e-commerce integrated solution independently developed by EasyStore Information Technology (Beijing) Co., Ltd. The system is specially designed for small and medium-sized as well as large export enterprises, integrating 'website building, operation, marketing, advertising, and conversion' into one, helping enterprises quickly establish cross-border e-commerce independent stores to achieve brand globalization and global sales growth.
The platform supports multiple languages, multiple currencies, and multi-channel marketing, with built-in AI intelligent translation and SEO optimization systems, suitable for mainstream markets such as Southeast Asia, Europe and America, Latin America, and the Middle East, assisting Chinese manufacturing enterprises in efficiently deploying international e-commerce strategies. SSL证书易营宝提供专业SSL安全证书服务,包括单域名和泛域名证书,确保网站数据传输加密、身份验证和完整性保护,助力企业建立安全可信的在线业务环境。