








- Can the average annual growth rate reflect real opportunities in overseas markets?Oct 07, 2026View details
- Which customer acquisition channels will be affected by cross-border marketing trends in 2026?Sep 06, 2026View details
- Which homogenization risks should be considered in an analysis of the AI-powered website building industry?Aug 30, 2026View details
- How Will AI Marketing Trends 2026 Change Advertising Budget AllocationAug 28, 2026View details
- Is the EV SSL certificate market shrinking or upgrading? How should companies assess certificate procurement?Aug 11, 2026View details
- Why the old AMP SEO 2020 practices no longer work and what has changed in current optimization prioritiesAug 02, 2026View details
How can you measure the speed improvement from a global network acceleration service in Latin America?
When an overseas website opens normally in your home market, but visitors in Latin America report that product images take a long time to appear and inquiry pages load slowly, these issues can affect the landing page experience and may also lead the marketing team to misjudge traffic quality. Does a global acceleration network significantly improve access speeds in Latin America? The answer depends on local access networks, acceleration node coverage, origin routing, and page resources. You cannot judge its effectiveness solely by whether it is connected to global nodes.
An effective way to test it is to run paired tests on the same website, with acceleration enabled and disabled, across multiple Latin American cities and carrier networks, while monitoring request times, page loads, and failure rates. First confirm which part of the process acceleration improves, then determine whether the improvement extends to your main customer regions.
Fix the Comparison Conditions First
Before testing, define the scope of the solution: does it include static resource caching, dynamic request routing optimization, or both? Accelerating only images and scripts may not shorten inquiry submission times. Likewise, a nearby edge node does not necessarily mean a shorter origin route for uncached requests.
Select a product detail page, an advertising landing page, and a read-only dynamic endpoint as test subjects. Both groups should use the same origin server, page version, resource sizes, and backend configuration. Do not enable acceleration for one group while changing image formats or upgrading the server; otherwise, you will not be able to determine the cause of any improvement.
- Keep the actual access path: Prefer switching configurations on the same domain and confirm that the configuration has taken effect. If you use two test domains, check that certificates, redirects, caching rules, and resource URLs are consistent.
- Test cache states separately: Distinguish between a cold browser cache, an edge cache miss, and an edge cache hit. A visitor's first access does not necessarily mean the edge node has no cached copy.
- Control browser variables: Keep the device, browser version, viewport, and network throttling conditions consistent. Record whether connections are reused to avoid reusing connections in one group while performing new handshakes in the other.
Choosing Representative Test Locations in Latin America
Select test locations based on your customer distribution, rather than choosing just one convenient cloud data center. You could select relevant cities such as São Paulo, Brazil; Mexico City, Mexico; and Santiago, Chile, then add local broadband or mobile networks in your key markets. Include the country, city, carrier, and network type in the test records.
Cloud servers are suitable for repeatedly running request tests, but their international egress and interconnection quality may differ from those experienced by ordinary users. Use cloud test locations to diagnose network paths, then validate the results using local user networks or real-user performance data. A VPN egress point represents only the route from that egress point and should not be treated as a direct measure of the local visitor experience.
Run multiple test rounds on different dates and during local peak and off-peak business hours. Alternate the baseline and accelerated groups to reduce the bias caused by network fluctuations. Determine the sample size for each round in a preliminary run, and do not remove slow requests after the formal test simply because the results do not look favorable.

Measure at Two Levels: Requests and Pages
At the first level, measure individual requests. Use curl to capture DNS lookup, TCP connection, TLS handshake, time to first byte, and total time. Also record the status code, response body size, remote IP, and cache response headers. Keep the request method and compression settings consistent, and retain timeouts and errors.
curl's time_namelookup, time_connect, time_appconnect, and time_starttransfer values are generally cumulative from the start of the request, so they cannot be added together as independent stage durations. For a direct HTTPS connection without redirects, you can estimate connection and handshake times from the differences between adjacent time points. The time to first byte still includes network round trips and server-side processing; it is not equivalent to backend execution time alone.
At the second level, use a browser to load the complete page and save the request waterfall. Check whether the HTML, main image, scripts, and APIs all go through acceleration, and whether third-party resources still use other routes. Page load event timing can provide a useful reference, but it should not replace LCP; dynamic pages may also continue requesting critical content after the load event fires.
Calculating Improvements Without Letting Averages Hide Problems
Report results separately by “city + carrier + page + cache state”; do not combine all test locations into a single average first. Calculate the percentage improvement in time as (baseline time − time with acceleration) ÷ baseline time × 100%, and also report the difference in milliseconds. A negative value indicates slower performance. Use consistent statistical measures in the same formula—for example, compare P50 values throughout.
Define “significant improvement” before testing: typical response times in key markets improve, the slow-request tail decreases, and the failure rate does not worsen. The specific threshold depends on the current user experience and business requirements; there is no single percentage that applies to every website. When the sample size is sufficient, use confidence intervals to help determine whether the difference is consistent, rather than relying on the single fastest result.
Report the cache hit rate as well. Repeatedly accessing the same resource on a test site may produce an overly optimistic hit rate. If a live site has many low-traffic product pages, personalized parameters, or frequent updates, the actual benefits may be smaller. Do not cache sensitive responses for login, shopping cart, or inquiry submissions just to increase the hit rate.
Trace the Network Path When Metrics Improve Unevenly
If TTFB decreases but LCP does not improve, first check whether the main image still comes from a domain that is not accelerated and whether scripts are blocking rendering. If static resources get faster but dynamic endpoints do not, check the origin routing and backend processing time. If performance remains slow in a particular country, verify the actual edge node, carrier interconnection, and whether traffic is taking a detour. Do not draw conclusions based solely on the node's geographic location.
For the final evaluation, retain regional data, cache states, and failure records, then validate real-user performance through a limited rollout. Changes in inquiries or orders can be monitored as subsequent business outcomes, but traffic sources and page content also affect conversions, so conversion changes cannot be attributed directly to network acceleration. Expand the rollout only when laboratory tests and real-world performance in key markets confirm each other.
Related Articles



Related Products
 Yiyingbao SaaS Intelligent Website Building and Marketing SystemYiyingbao SaaS Intelligent Website Building and Marketing System, AI-powered no-code website building, rapid creation of multilingual B2B international websites in 10 minutes, global server acceleration, AI-powered SEO optimization, helping businesses connect efficiently with global markets. The perfect integration of technology and operation makes building an international trade website remarkably simple
 AI+SEM Intelligent Advertising Marketing SystemAI+SEM drives intelligent ad creation, empowering full-funnel precision advertising marketing. The system automatically generates weekly/monthly reports, AI recommends keywords and target countries, monitors core metrics in real-time with intelligent alerts, and enables one-click high-conversion ad solutions to help quickly acquire customers and improve ROI.
 AI+SEO Dual-Engine System Optimization ServicesYiyingbao’s AI+SEO dual-engine optimization system helps foreign trade enterprises acquire high-quality organic traffic through AI-powered keyword research, content generation, and comprehensive technical optimization, significantly improving search rankings and conversion rates.
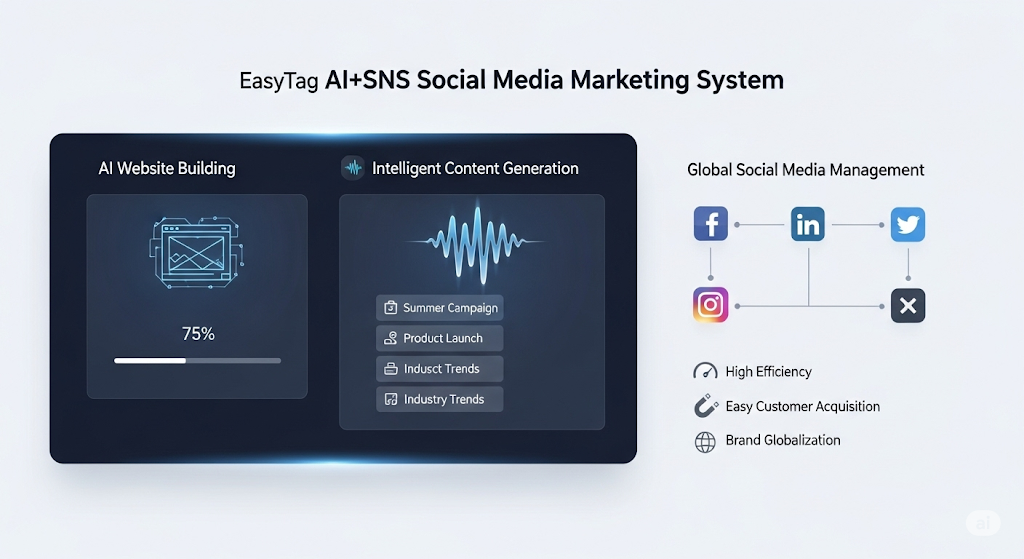
 AI+SNS Social Media Marketing SystemYingbao AI+SNS Social Media Marketing System - Precision social capture for the social media era. Supports one-click content synchronization across major platforms like Facebook and LinkedIn. AI intelligently rewrites posts for enhanced relevance. 24/7 AI customer service and user profiling analysis empower businesses to efficiently expand into global markets.
 AI+SEO营销解决方案易营宝AI+SEO营销解决方案,通过AI批量写作、智能生成TDK、精准关键词扩词等功能,全面优化网站SEO效果,提升流量与转化率。助力企业构建高效智能网站新生态。
 AI+SEM Advertising Marketing SolutionsAI+SEM Advertising Marketing Solution leverages AI technology to deeply empower SEM ad campaigns. It automatically generates weekly/monthly reports using AI, presenting account data across multiple dimensions for comprehensive insights into campaign performance and trends. The system precisely recommends keywords and target countries, intelligently generates high-conversion ad copy, and enables one-click activation of efficient campaign plans to help businesses rapidly acquire customers. Simultaneously, it monitors core metrics in real time, intelligently identifies abnormal fluctuations, and issues timely alerts to ensure stable, high-return advertising results.
 Domain Name ServicesEasyWin provides professional domain name services, including intelligent queries, one-stop registration, brand protection, and full lifecycle management, helping businesses build a digital brand image.
 EasyOperate B2C Cross-Border E-Commerce Platform & Independent WebsiteEasyStore B2C Cross-border E-commerce Independent Store is an intelligent website building and cross-border e-commerce integrated solution independently developed by EasyStore Information Technology (Beijing) Co., Ltd. The system is specially designed for small and medium-sized as well as large export enterprises, integrating 'website building, operation, marketing, advertising, and conversion' into one, helping enterprises quickly establish cross-border e-commerce independent stores to achieve brand globalization and global sales growth.
The platform supports multiple languages, multiple currencies, and multi-channel marketing, with built-in AI intelligent translation and SEO optimization systems, suitable for mainstream markets such as Southeast Asia, Europe and America, Latin America, and the Middle East, assisting Chinese manufacturing enterprises in efficiently deploying international e-commerce strategies. SSL证书易营宝提供专业SSL安全证书服务,包括单域名和泛域名证书,确保网站数据传输加密、身份验证和完整性保护,助力企业建立安全可信的在线业务环境。