








- 21st Century Business Herald: AI and CTV Become Core Growth Engines for Digital Marketing in Overseas MarketsNov 18, 2026View details
- China Presents 25 Cooperation Outcomes in Areas Including Cross-Border E-Commerce During APECNov 18, 2026View details
- AI Products Drive Hong Kong Exports Up 64.9% in September, Fastest Growth in Over 40 YearsNov 17, 2026View details
- National Bureau of Statistics: Foreign trade grew rapidly in October, providing stable support for global tradeNov 17, 2026View details
- The U.S. has ended the $800 de minimis exemption for non-postal shipments; express courier packages must be formally declared.Nov 16, 2026View details
- ASEAN Signs Digital Economy Framework Agreement, Moving Toward Harmonized Cross-Border E-Commerce RulesNov 15, 2026View details
How to Choose a Global Website Latency Monitoring Tool?
When choosing a global website latency monitoring tool, first check whether it can test key pages from the regions where your target customers are located, under conditions that closely resemble real visits. Then compare its metrics, alerts, and costs. A large number of monitoring locations and detailed report charts do not necessarily mean the tool can identify the issues that matter to your business. If most of your customers are in Southeast Asia but monitoring locations are concentrated in Europe and the Americas, the resulting data will be of limited use for assessing the local browsing experience.
When evaluating tools, distinguish between two types of needs: identifying whether a website is inaccessible or responding more slowly, and explaining why visitors feel that a page is slow. Basic HTTP monitoring may be sufficient for the first, while the second usually requires browser testing, detailed resource loading data, and possibly real user data. Clarifying which problem you need to solve can help you avoid both inadequate functionality and paying for capabilities you do not currently need.
Check monitoring locations against your target markets first
Monitoring coverage should be based on traffic sources and business priorities. When reviewing a tool’s list of locations, check not only the countries and regions available, but also whether you can select specific cities and network types, and whether those locations are included in the plan you intend to purchase. For cross-border websites, access routes can vary even within the same region, so latency at a single location does not necessarily reflect the experience of all local users.
You can divide your target markets into core markets and markets to monitor periodically: use the former for continuous monitoring and alerts, and sample the latter at regular intervals. If your website serves multiple language regions, test the corresponding language pages separately. Testing only the English homepage cannot reflect resource loading and redirects on pages in other languages.
Also consider the testing environment. Data center locations are suitable for consistent comparisons over time, but their network conditions may not match those of home broadband or mobile networks. If your business depends heavily on mobile traffic, prioritize assessing whether the tool supports mobile device emulation, network throttling, or experience data from real users. Simulated environments help standardize testing conditions, but cannot fully replace real users’ networks and devices.

Do not confuse server response time with page load speed
When evaluating a tool, first confirm exactly what its reported “latency” measures. DNS lookup time, connection establishment time, Time to First Byte (TTFB), and the time it takes for visible page content to load reflect different stages. A slowdown in one metric only indicates that an issue may lie in the corresponding part of the request path; a single number cannot determine whether the cause is the server, CDN, or page code.
For example, HTTP monitoring is suitable for checking endpoints, status codes, and basic response times, and typically involves lower costs and maintenance overhead. However, it does not execute scripts fully as a browser would, nor can it tell you when users see the main content. If an advertising landing page relies on script rendering, forms, or third-party tracking code, synthetic browser monitoring can provide more diagnostic value: it opens the page at specified locations and intervals and observes the loading process.
For browser monitoring, first check whether you can view resource waterfalls, failed requests, redirects, and page screenshots. A waterfall chart can help identify whether a particular image, script, or third-party service is slowing down the page. Screenshots can help reveal cases where the page returns successfully but displays a blank screen, overlay, or error message. If the tool supports user experience metrics such as LCP, also find out about its test devices, network conditions, and measurement methodology so you do not compare results obtained under different conditions directly.
Real User Monitoring (RUM) and synthetic monitoring can complement each other: the former observes the experience of actual visitors across different devices and networks, while the latter makes it easier to run continuous tests and reproduce issues under consistent conditions. However, real user data depends on actual traffic; a new website or a low-traffic region may have limited data, so do not draw conclusions about overall trends too readily. Before deployment, also assess the scope of data collection, privacy requirements, and impact on page performance.
Alerts should reduce noise and help pinpoint issues
A single probe timeout may be caused by a temporary network fluctuation or an issue with the monitoring location itself. When choosing a tool, check whether it supports alerts after consecutive failures, cross-validation across multiple locations, and rules based on region, page, and severity. For key inquiry pages, notify on-call staff promptly; for lower-priority content pages, rules can be less strict to avoid excessive alerts that might cause the team to overlook genuine outages.
A slower response does not necessarily mean the website is unavailable. In addition to status codes, check whether the tool supports content matching, redirect checks, and certificate expiration reminders. For example, if the server returns a successful status but the page body contains an error message, status-code monitoring alone may not detect it. For workflows involving login, shopping carts, or inquiry submissions, also assess whether the tool supports multi-step tests and how test accounts and data are managed.
Alert details should ideally include the location, start time, failure type, and relevant request details, and be sent to the notification channels your team actually uses. Alert duration, repeat notification intervals, and recovery notifications also affect response efficiency: recipients need to know whether the issue is still occurring and where to begin investigating.
Test the same pages first, then compare costs
Do not rely on feature lists alone. Select the homepage, key advertising landing pages, product detail pages, and inquiry or checkout flows, and run trials from the same locations in your core markets. Where possible, configure each candidate tool with the same testing frequency, devices, and network conditions, then assess the following:
- Can it detect the expected issues: When test pages have missing content, failed requests, or slower responses, can the tool provide useful alerts and diagnostic clues?
- Are the results easy to compare: Can you view trends by region, time period, and page, and export data for team analysis?
- Does it support collaboration: Does it offer access controls, an API, or integration with existing alerting systems, so data does not remain confined to a separate console?
- How will costs scale: Confirm whether charges depend on the number of monitoring locations, testing frequency, browser test volume, data retention period, or additional users.
When comparing quotes, estimate actual usage based on your planned pages, regions, and testing frequency. Monitoring multiple pages across several regions can quickly increase the number of tests. Browser tests and basic HTTP checks may also be billed differently. If your budget is limited, start with browser tests for core business workflows and use basic monitoring for other pages, then adjust based on alerts and traffic changes.
Integrate monitoring results into website and marketing workflows
Monitoring tools help detect and diagnose issues, but improving the user experience also depends on whether your team can make changes to the website, CDN, server, and third-party scripts. During evaluation, clarify who receives alerts, who is responsible for resolving issues, and what logs and collaboration support your website service provider can offer. For businesses running multilingual websites, SEO, and advertising campaigns at the same time, comparing landing page speed changes by region with ad campaign schedules and page update records can help narrow down the investigation. However, speed changes alone cannot establish the cause of conversion rate changes.
Yingbaobao provides services including intelligent website building, multilingual website development, and overseas marketing. When using an integrated service, clarify during the selection process who has permission to modify pages, how technical support responsibilities are divided, and how third-party monitoring tools can be integrated. The final choice should be based on coverage of target markets, the testability of business workflows, and your team’s ability to handle issues.
Related Articles
 Which Is Better for Building a Foreign Trade Website: Yiyingbao or Shopify?
 How to Choose a Global Website Latency Monitoring Tool?
 How do you evaluate the multilingual capabilities of an AI website-building platform?



Related Products
 Yiyingbao SaaS Intelligent Website Building and Marketing SystemYiyingbao SaaS Intelligent Website Building and Marketing System, AI-powered no-code website building, rapid creation of multilingual B2B international websites in 10 minutes, global server acceleration, AI-powered SEO optimization, helping businesses connect efficiently with global markets. The perfect integration of technology and operation makes building an international trade website remarkably simple
 AI+SEM Intelligent Advertising Marketing SystemAI+SEM drives intelligent ad creation, empowering full-funnel precision advertising marketing. The system automatically generates weekly/monthly reports, AI recommends keywords and target countries, monitors core metrics in real-time with intelligent alerts, and enables one-click high-conversion ad solutions to help quickly acquire customers and improve ROI.
 AI+SEO Dual-Engine System Optimization ServicesYiyingbao’s AI+SEO dual-engine optimization system helps foreign trade enterprises acquire high-quality organic traffic through AI-powered keyword research, content generation, and comprehensive technical optimization, significantly improving search rankings and conversion rates.
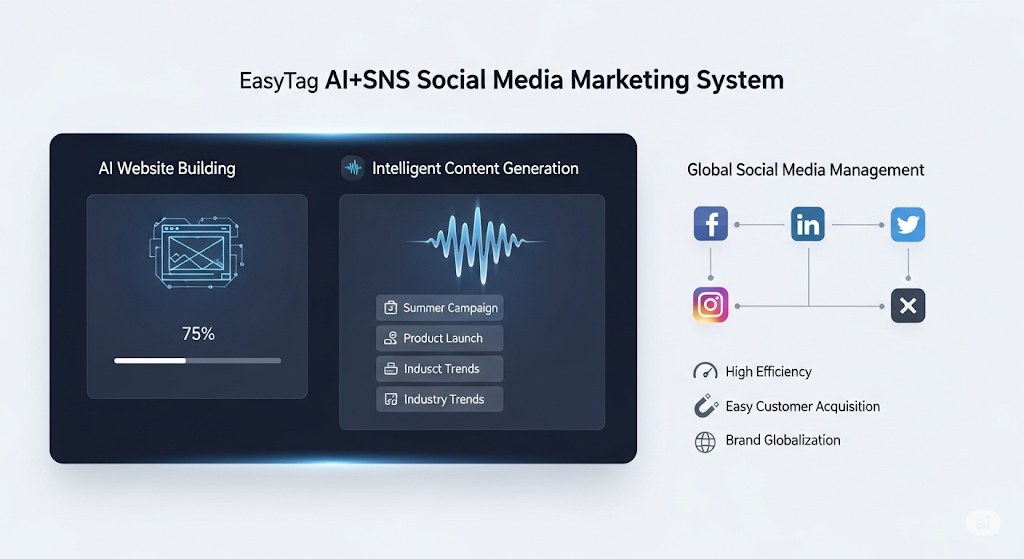
 AI+SNS Social Media Marketing SystemYingbao AI+SNS Social Media Marketing System - Precision social capture for the social media era. Supports one-click content synchronization across major platforms like Facebook and LinkedIn. AI intelligently rewrites posts for enhanced relevance. 24/7 AI customer service and user profiling analysis empower businesses to efficiently expand into global markets.
 AI+SEO营销解决方案易营宝AI+SEO营销解决方案,通过AI批量写作、智能生成TDK、精准关键词扩词等功能,全面优化网站SEO效果,提升流量与转化率。助力企业构建高效智能网站新生态。
 AI+SEM Advertising Marketing SolutionsAI+SEM Advertising Marketing Solution leverages AI technology to deeply empower SEM ad campaigns. It automatically generates weekly/monthly reports using AI, presenting account data across multiple dimensions for comprehensive insights into campaign performance and trends. The system precisely recommends keywords and target countries, intelligently generates high-conversion ad copy, and enables one-click activation of efficient campaign plans to help businesses rapidly acquire customers. Simultaneously, it monitors core metrics in real time, intelligently identifies abnormal fluctuations, and issues timely alerts to ensure stable, high-return advertising results.
 Domain Name ServicesEasyWin provides professional domain name services, including intelligent queries, one-stop registration, brand protection, and full lifecycle management, helping businesses build a digital brand image.
 EasyOperate B2C Cross-Border E-Commerce Platform & Independent WebsiteEasyStore B2C Cross-border E-commerce Independent Store is an intelligent website building and cross-border e-commerce integrated solution independently developed by EasyStore Information Technology (Beijing) Co., Ltd. The system is specially designed for small and medium-sized as well as large export enterprises, integrating 'website building, operation, marketing, advertising, and conversion' into one, helping enterprises quickly establish cross-border e-commerce independent stores to achieve brand globalization and global sales growth.
The platform supports multiple languages, multiple currencies, and multi-channel marketing, with built-in AI intelligent translation and SEO optimization systems, suitable for mainstream markets such as Southeast Asia, Europe and America, Latin America, and the Middle East, assisting Chinese manufacturing enterprises in efficiently deploying international e-commerce strategies. SSL证书易营宝提供专业SSL安全证书服务,包括单域名和泛域名证书,确保网站数据传输加密、身份验证和完整性保护,助力企业建立安全可信的在线业务环境。