








- AliExpress Global Double 11: Brand Sales Grow Nearly 50% in the First Week, U.S. GMV Rises 70%Nov 21, 2026View details
- Ministry of Commerce Reports E-commerce Development from January to October 2026, with Cross-Border Imports Performing StronglyNov 21, 2026View details
- Amazon Black Friday Orders Sluggish on Day One; NRF Forecasts 4.2 Million Fewer ParticipantsNov 21, 2026View details
- 21st Century Business Herald: AI and CTV Become Core Growth Engines for Digital Marketing in Overseas MarketsNov 18, 2026View details
- China Presents 25 Cooperation Outcomes in Areas Including Cross-Border E-Commerce During APECNov 18, 2026View details
- AI Products Drive Hong Kong Exports Up 64.9% in September, Fastest Growth in Over 40 YearsNov 17, 2026View details
How to troubleshoot slow server response times when optimizing website speed?
Where should you start when optimizing website response speed? Support and maintenance staff can identify the cause of slow responses step by step by checking server load, network latency, and database performance. First determine where the slowdown occurs, then decide whether to scale up. This helps reduce unnecessary changes and repeated troubleshooting.
A slow server response does not necessarily mean that the server is underprovisioned. Page generation, database queries, external APIs, or cross-border networks can all cause delays. Slow loading of front-end resources can also make the website feel sluggish, so first identify which part of the process is causing the problem.
Step 1: Determine whether the server or page resources are slow

First, record when the issue occurred, the visitor's location, the affected pages, and how often it can be reproduced. Ask users whether all pages are slow or whether the slowdown occurs only when searching, submitting a form, or checking out. This information helps maintenance staff assess the scope of the problem and avoid blindly restarting the server as a first step.
Open the Network panel in your browser's developer tools and reload the page. Check the waiting time for the main document request. If the main document takes a long time while images and scripts load quickly, prioritize checking the server side. If the main document loads quickly but subsequent resources take longer, continue by checking front-end resources and the delivery path.
You can also use the command line to record connection and time-to-first-byte metrics. For example, run curl -o /dev/null -s -w 'connect:%{time_connect} ttfb:%{time_starttransfer} total:%{time_total}' https://example.com/, replacing the URL with the page you want to test.
Time to first byte includes stages such as connection setup, network transmission, and server processing, so it cannot be equated directly with server processing time. Run multiple tests under the same network conditions and compare the results with data from normal periods. Also distinguish between the home page, dynamic pages, and static resources.
What should you check when server load increases?
Log in to the server or review monitoring data on your cloud platform. Focus on CPU utilization, memory usage, disk I/O, network bandwidth, and connection counts during the affected period. If metrics are abnormal only during traffic peaks, investigate further to determine whether the cause is a traffic surge, a scheduled task, or unusual requests.
If the CPU remains busy, review the process list and application logs to identify the processes consuming the most resources. If memory is insufficient and swap space is being used frequently, check the number of processes, memory leaks, and cache configuration. High disk I/O latency warrants checking logs, backups, and database operations.
If server metrics are normal but requests are still queuing, also check the number of application workers, connection pools, and wait times at the reverse proxy. Do not decide to upgrade based only on momentary utilization. Use trends and request volumes during the affected period to determine whether the resource bottleneck is persistent.
How can you tell whether slow access for overseas users is a network issue?
For websites targeting overseas markets, test from the regions where your main customers are located rather than relying only on your domestic office network. Select monitoring nodes in several regions and access the home page, inquiry page, and static resources from each one. Compare connection time, time to first byte, and total page load time.
If the site is slow in multiple regions and processing time at the origin server is also high, prioritize checking the application and database. If only certain regions are slow while origin server metrics are normal, check the local network, DNS resolution, content delivery nodes, and connections to the origin server.
You can use traceroute, tracert, or cloud monitoring tools to help observe changes along the network path. However, some nodes may restrict probe packets, so a timeout on a single test does not necessarily indicate an actual fault. Make an assessment based on multiple access tests, networks from different carriers, and service provider monitoring.
For access across regions, consider using a content delivery network to cache images, stylesheets, and scripts, and check the cache hit rate and origin fetch time. Configure caching for dynamic pages carefully based on login status, pricing, and user data to avoid displaying incorrect content.
How can you identify the cause of slow databases and external APIs?
If product listings, on-site searches, or inquiry submissions are noticeably slower than ordinary pages, first review application distributed tracing and database slow query logs. Record the operations taking the most time and how often they occur. Check whether queries lack suitable indexes, scan too much data, or are waiting on locks.
Review the query execution plan before deciding whether to adjust indexes or rewrite queries. Validate the results in a test environment before deployment, and assess the impact of new indexes on writes and storage. If the connection limit is being reached, also check whether connections are released promptly and whether the connection pool is configured appropriately.
External services can also slow down pages, including payment, logistics, translation, and marketing data APIs. Check the response times, timeouts, and error rates for each API to determine whether the issue is concentrated at a particular provider. For non-critical data, consider caching or asynchronous processing, and set reasonable timeout and fallback policies.
If the website uses a third-party website-building or marketing platform, maintenance staff may not have direct access to database or application logs. In that case, compile the affected URLs, incident times, visitor locations, request IDs, and test results, then submit them to the platform provider for assistance with troubleshooting.
In what order should you address bottlenecks once they are identified?
Prioritize issues that affect many users and can be resolved quickly, such as abnormal traffic consuming all available bandwidth, an API waiting for an excessive amount of time, or a scheduled task using large amounts of resources. Before restarting services, applying rate limits, or changing configurations, assess the impact on active visitors and business operations, and prepare a rollback plan.
For recurring issues, plan longer-term optimization, such as tuning slow queries, reducing duplicate requests, fixing resource leaks, or scaling up based on consistent capacity data. Scaling up is appropriate when resources are persistently insufficient. If the bottleneck is an inefficient query or a third-party API, simply adding capacity may have limited effect.
Caching can reduce repeated computation and database load, but it requires an appropriate expiration period and update mechanism. Pay particular attention to freshness and access permissions for product inventory, order status, and user-specific information. After changing the caching strategy, verify that different users see the correct data.
How can you verify the results of optimization and prevent the website from slowing down again?
Compare results before and after the issue using the same test pages, regions, and network conditions. Record time to first byte, request success rate, server load, and the response times of key APIs. In addition to averages, pay attention to peak periods and slower requests so that a small number of severe slowdowns are not hidden by average figures.
Do not limit verification to the home page. For a foreign trade website, test multilingual pages, product details, and inquiry forms. For a cross-border e-commerce store, also test search, the shopping cart, and checkout to confirm that prices, inventory, and submission results remain accurate after performance improves.
When setting up ongoing monitoring, configure alerts for availability, response time, error rate, and resource utilization, and adjust thresholds based on historical performance and business requirements. Regularly record the cause of incidents, the steps taken, and recovery times to support handovers and reviews within the support team.
The key to optimizing website response speed is to first distinguish delays in the browser, network, application, and data layers, then address bottlenecks based on evidence. Businesses using website-building and marketing services such as 易营宝 can also work with platform support staff to troubleshoot issues and continuously monitor overseas user experience and inquiry flows.
Related Articles
 XYZ Applies for the .seo Top-Level Domain in ICANN’s New Round; Launch May Be Coming Soon
 How to troubleshoot slow server response times when optimizing website speed?
 How can you configure browser caching to improve website loading speed?



Related Products
 Yiyingbao SaaS Intelligent Website Building and Marketing SystemYiyingbao SaaS Intelligent Website Building and Marketing System, AI-powered no-code website building, rapid creation of multilingual B2B international websites in 10 minutes, global server acceleration, AI-powered SEO optimization, helping businesses connect efficiently with global markets. The perfect integration of technology and operation makes building an international trade website remarkably simple
 AI+SEM Intelligent Advertising Marketing SystemAI+SEM drives intelligent ad creation, empowering full-funnel precision advertising marketing. The system automatically generates weekly/monthly reports, AI recommends keywords and target countries, monitors core metrics in real-time with intelligent alerts, and enables one-click high-conversion ad solutions to help quickly acquire customers and improve ROI.
 AI+SEO Dual-Engine System Optimization ServicesYiyingbao’s AI+SEO dual-engine optimization system helps foreign trade enterprises acquire high-quality organic traffic through AI-powered keyword research, content generation, and comprehensive technical optimization, significantly improving search rankings and conversion rates.
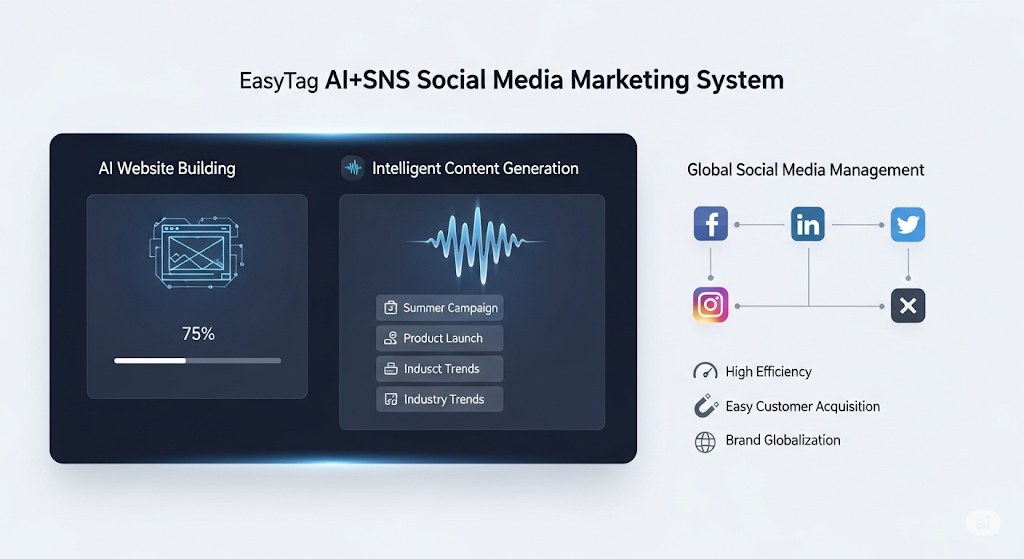
 AI+SNS Social Media Marketing SystemYingbao AI+SNS Social Media Marketing System - Precision social capture for the social media era. Supports one-click content synchronization across major platforms like Facebook and LinkedIn. AI intelligently rewrites posts for enhanced relevance. 24/7 AI customer service and user profiling analysis empower businesses to efficiently expand into global markets.
 AI+SEO营销解决方案易营宝AI+SEO营销解决方案,通过AI批量写作、智能生成TDK、精准关键词扩词等功能,全面优化网站SEO效果,提升流量与转化率。助力企业构建高效智能网站新生态。
 AI+SEM Advertising Marketing SolutionsAI+SEM Advertising Marketing Solution leverages AI technology to deeply empower SEM ad campaigns. It automatically generates weekly/monthly reports using AI, presenting account data across multiple dimensions for comprehensive insights into campaign performance and trends. The system precisely recommends keywords and target countries, intelligently generates high-conversion ad copy, and enables one-click activation of efficient campaign plans to help businesses rapidly acquire customers. Simultaneously, it monitors core metrics in real time, intelligently identifies abnormal fluctuations, and issues timely alerts to ensure stable, high-return advertising results.
 Domain Name ServicesEasyWin provides professional domain name services, including intelligent queries, one-stop registration, brand protection, and full lifecycle management, helping businesses build a digital brand image.
 EasyOperate B2C Cross-Border E-Commerce Platform & Independent WebsiteEasyStore B2C Cross-border E-commerce Independent Store is an intelligent website building and cross-border e-commerce integrated solution independently developed by EasyStore Information Technology (Beijing) Co., Ltd. The system is specially designed for small and medium-sized as well as large export enterprises, integrating 'website building, operation, marketing, advertising, and conversion' into one, helping enterprises quickly establish cross-border e-commerce independent stores to achieve brand globalization and global sales growth.
The platform supports multiple languages, multiple currencies, and multi-channel marketing, with built-in AI intelligent translation and SEO optimization systems, suitable for mainstream markets such as Southeast Asia, Europe and America, Latin America, and the Middle East, assisting Chinese manufacturing enterprises in efficiently deploying international e-commerce strategies. SSL证书易营宝提供专业SSL安全证书服务,包括单域名和泛域名证书,确保网站数据传输加密、身份验证和完整性保护,助力企业建立安全可信的在线业务环境。