Definition of Data Analysis Tools: Transforming Raw Data into Business Insights Software Systems
Data Analysis Tools are a series of applications and platforms used for collecting, storing, cleaning, transforming, modeling, and visualizing data. Their core function is to help users discover patterns, trends, and correlations from complex, often unstructured data, thereby supporting decision-making and performance evaluation.
Three Core Functions of Data Analysis Tools:
Data Processing (Data Processing): Includes data cleaning (Data Cleaning), ensuring data accuracy, completeness, and consistency, as well as data transformation (ETL/ELT), preparing data for analysis and modeling.
Data Modeling & Mining (Modeling & Mining): Utilizes statistics, machine learning, AI algorithms, and other technologies to uncover deep patterns in data, enabling prediction, classification, or clustering.
Data Visualization & Reporting (Visualization & Reporting): Presents complex analysis results through** charts, dashboards (Dashboards)**, ensuring business personnel can quickly understand and take action.
Strategic Value of Data Analysis Tools: Transforming historical and real-time data into predictive future business intelligence (Business Intelligence).
History of Data Analysis Tools: From Manual Calculations to AI-Driven Insights
The evolution of data analysis tools reflects humanity's growing ability and automation needs in processing vast amounts of data.
1. Early Stages: Manual Calculations & Statistical Software (1950s-1990s)
Tool Features: Primarily relied on **spreadsheets (e.g., Lotus 1-2-3)** for basic data aggregation and calculations, as well as specialized statistical software packages like SPSS and SAS.
Limitations: Lacked data visualization capabilities, handled small data volumes, had slow analysis speeds, and heavily depended on manual statistical knowledge.
2. Rise of Business Intelligence (BI) (1990s-2010):
Technological Drivers: With the maturation of** data warehouses (Data Warehouse)** and **OLAP (Online Analytical Processing)** technologies, enterprises began building centralized data analysis systems.
Tool Representatives:BusinessObjects, Cognos, and other traditional BI tools, focusing on structured data reports and fixed queries.
Challenges: High implementation costs, poor flexibility, primarily serving senior management.
3. Data Visualization & Self-Service BI (2010-2020):
Core Revolution:Tableau, Power BI, and other self-service BI tools emerged. They offered drag-and-drop interfaces, enabling non-technical users to perform complex queries and visualizations.
Technical Features: Emphasized usability, interactivity, and real-time data connectivity, decentralizing data analysis from IT departments to business units.
4. Big Data, Cloud-Native & AI-Driven (2020-Present):
Technological Trends: **Cloud computing (AWS/Azure/GCP)** became mainstream, supporting processing of TB/PB-scale big data.
Tool Upgrades: Introduced Python, R, and other open-source language ecosystems, as well as AI-driven automated insights (e.g., anomaly detection, natural language queries).
Focus Areas:Real-time capabilities, scalability, and predictive analytics.
Technical Principles of Data Analysis Tools: From ETL to Machine Learning Models
The underlying mechanisms of modern data analysis tools integrate data engineering, statistics, and AI technologies into a complex workflow.
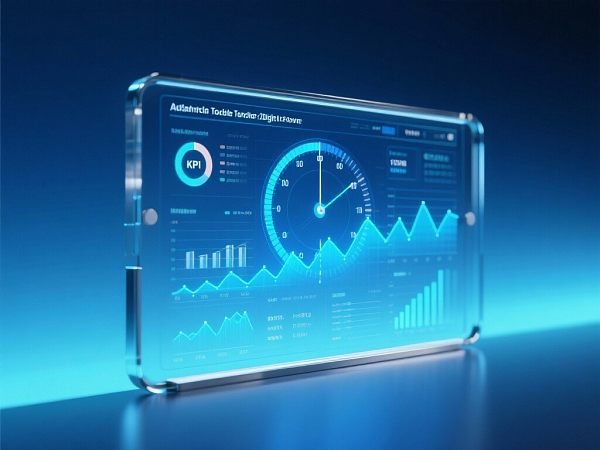
1. Data Integration & Engineering (ETL/ELT)
Principle:Extract, Transform, Load. Tools extract data from multiple sources (CRM, ERP, websites, databases), process it through cleaning (deduplication, filling missing values) and standardization, and finally load it into data warehouses or analytical databases.
Cloud-Native Advantage: Modern tools often adopt the ELT model, directly loading raw data into cloud warehouses (e.g., Snowflake) and leveraging cloud computing power for transformations, improving efficiency.
2. Online Analytical Processing (OLAP) & Multidimensional Data Modeling
Principle: OLAP allows users to perform multidimensional, interactive queries, slicing, and drilling operations on data.
Technical Core: Tools organize data into multidimensional datasets (Cubes), enabling rapid responses to complex aggregate queries, the foundation of business intelligence reporting.
3. Statistical Models & Machine Learning (ML)
Principle: Advanced tools embed or integrate Python/R environments to run complex regression analysis, time-series forecasting, classification, clustering, and other statistical and ML models.
Application: Used for predicting customer churn, product sales, or performing granular customer segmentation.
4. Visualization Rendering & Interactive Technologies
Principle: Tools use efficient graphics rendering engines (e.g., WebGL or Canvas) to transform data into dynamic, interactive charts.
Technical Goal: Ensure fast loading and responsive charts when handling large datasets, enhancing user experience.
Core Features & Strategic Advantages of Data Analysis Tools
Excellent data analysis tools not only provide data but also help businesses quickly transform it into actionable decisions.
1. Self-Service & Ease of Use (Self-Service)
Features: Adopt visual, drag-and-drop interfaces, eliminating the need for complex coding (e.g., SQL or Python).
Advantage:Empowers business users (e.g., sales, marketing, operations) to independently query and analyze data, accelerating decision cycles.
2. Real-Time & Agile Reporting (Real-Time & Agility)
Features: Can directly connect to real-time data sources (e.g., website logs, transaction databases) and refresh dashboards in seconds.
Advantage: Enables businesses to perform real-time monitoring and agile decision-making, such as adjusting budgets during promotions.
3. Predictive Analytics & Intelligent Insights
Features: Leveraging AI/ML models, tools can automatically identify anomalies, key trends from historical data and perform future trend predictions.
Advantage: Elevates analysis from describing "what happened"to predicting"what will happen", achieving strategic foresight.
4. High Integration & Scalability (Integration & Scalability)
Features: Can seamlessly integrate with mainstream databases, cloud services, CRM, and ERP systems. Simultaneously, capable of scaling to handle growing TB-scale data volumes.
Advantage: Avoids data silos, ensuring all decisions are based on unified, complete, large-scale datasets.
Deep Applications & Business Value of Data Analysis Tools
Data analysis tools have permeated all aspects of business operations, becoming direct drivers of professionalism and conversion rates.
EasyProfit: Your Data Analysis Tool Selection, Deployment & Insights Expert
EasyProfit deeply understands the strategic value of data analysis tools. Our services go beyond tool deployment to encompass full-path transformation from data to insights to action.
Tool Selection & Architecture Planning: Based on your data volume, tech stack, and business goals, recommend and deploy the most suitable tool combinations (e.g., GA4, Tableau, Power BI, or custom Python scripts).
Data Engineering & Cleaning: Assist in building efficient ETL/ELT workflows, ensuring data from various channels (websites, ads, CRM) is clean, consistent, and reliable.
Core KPI Dashboard Construction: Based on your business goals, build clear, interactive BI dashboards for at-a-glance performance monitoring.
Deep Predictive Analytics Services: Leverage machine learning models to perform customer segmentation, churn prediction, and sales forecasting on your data, elevating analysis to prediction.
Data-Driven Conversion Rate Optimization (CRO): Use website analysis tools (e.g., heatmaps, GA4) to identify conversion leaks in websites, guiding SEO and design optimizations.
Choose EasyProfit to make your data analysis tools truly become decision-enabling, growth-accelerating core drivers.
FAQ
1. As a small or medium-sized enterprise, which data analysis tools should I start with?
Recommend starting with free yet powerful foundational tools:
Google Analytics 4 (GA4): Suitable for website and app data analysis. It's free and provides core insights like user behavior, traffic sources, and conversion leaks.
Microsoft Power BI or Google Looker Studio: Suitable for data visualization and reporting. Power BI's desktop version is powerful and free, while Looker Studio easily connects with Google products for reporting.
2. What are the differences between traditional BI tools and modern self-service BI tools (e.g., Tableau)?
Core differences lie in flexibility, usability, and cost:
Traditional BI: Long implementation cycles, high costs, requiring deep IT involvement. Reports are typically static and fixed, difficult to adjust quickly.
Self-Service BI: Rapid implementation, intuitive interfaces (drag-and-drop), business users can operate independently. Reports are highly interactive and dynamic, able to respond agilely to ad-hoc analysis needs.

Customer Reviews
Mr. Yu, COO of a SaaS Software Company
“Previously, our data was scattered across Google Analytics, Salesforce, and Excel, making it impossible to gain unified insights. The EasyProfit team helped us build a cloud-based data warehouse and created a real-time core KPI dashboard using Power BI. Now, our marketing, sales, and product teams can all access accurate and consistent data on a unified platform. Most crucially, they helped us implement a customer churn prediction model, enabling us to proactively intervene with high-risk clients and successfully reduce churn rate by 15%.”
Ms. Yang, Founder of a Cross-Border E-Commerce Platform
“Before adopting professional tools, our decisions relied entirely on intuition. EasyProfit introduced advanced GA4 and visualization tools and assisted us in conducting in-depth funnel analysis. Through data analysis, we discovered our website had high add-to-cart rates but low checkout rates. Based on this insight, we optimized the checkout process, achieving a 12% increase in conversion rate within one month. The analytics tools truly revealed hidden profit opportunities, elevating our business to a new, data-driven level.”
![Is LinkedIn Marketing Really Suitable for B2B Foreign Trade? One Week of Test Data Tells You the Answer Is LinkedIn Marketing Really Suitable for B2B Foreign Trade? One Week of Test Data Tells You the Answer]() Is LinkedIn Marketing Really Suitable for B2B Foreign Trade? One Week of Test Data Tells You the AnswerEasyCampaign Test: Is LinkedIn Marketing Truly Effective for B2B Foreign Trade? A One-Week Real Sample Shows, Combined with Independent Site Operations, Website Speed Optimization, and Data Analysis Tools, and with SEO+SEM Integrated Marketing as the Core (Supported by Google Ads and Facebook Ads for Cross-Channel Verification), It Can Significantly Reduce Customer Acquisition Costs and Improve Lead Quality and Conversion Rates. Click to View Detailed Cases, Operation Checklists, and Actionable TikTok Marketing Synergy Plans for Rapid Growth Replication.
Is LinkedIn Marketing Really Suitable for B2B Foreign Trade? One Week of Test Data Tells You the AnswerEasyCampaign Test: Is LinkedIn Marketing Truly Effective for B2B Foreign Trade? A One-Week Real Sample Shows, Combined with Independent Site Operations, Website Speed Optimization, and Data Analysis Tools, and with SEO+SEM Integrated Marketing as the Core (Supported by Google Ads and Facebook Ads for Cross-Channel Verification), It Can Significantly Reduce Customer Acquisition Costs and Improve Lead Quality and Conversion Rates. Click to View Detailed Cases, Operation Checklists, and Actionable TikTok Marketing Synergy Plans for Rapid Growth Replication.![Low ROI on Facebook Ads? 90% of People Ignore These 2 Targeting Tips Low ROI on Facebook Ads? 90% of People Ignore These 2 Targeting Tips]() Low ROI on Facebook Ads? 90% of People Ignore These 2 Targeting TipsFacebook advertising ROI is low? Mastering LinkedIn marketing, TikTok operation and AI positioning skills, combined with Google Ads data analysis tools, Yiyingbao helps foreign trade enterprises to realize efficient conversion of overseas social media operation and improve global customer acquisition efficiency.
Low ROI on Facebook Ads? 90% of People Ignore These 2 Targeting TipsFacebook advertising ROI is low? Mastering LinkedIn marketing, TikTok operation and AI positioning skills, combined with Google Ads data analysis tools, Yiyingbao helps foreign trade enterprises to realize efficient conversion of overseas social media operation and improve global customer acquisition efficiency.![Yandex promotion cold but efficient? Tested CTR increase of 3 times in the Russian market Yandex promotion cold but efficient? Tested CTR increase of 3 times in the Russian market]() Yandex promotion cold but efficient? Tested CTR increase of 3 times in the Russian marketYandex promotion + EYB AI empowerment, measured CTR increase by 3 times! Combining Google Ads, Facebook ads and TikTok operation, creating a foreign trade marketing tool multilingual website, efficient layout of overseas social media operation.
Yandex promotion cold but efficient? Tested CTR increase of 3 times in the Russian marketYandex promotion + EYB AI empowerment, measured CTR increase by 3 times! Combining Google Ads, Facebook ads and TikTok operation, creating a foreign trade marketing tool multilingual website, efficient layout of overseas social media operation.![Poor Google Ads results? Try These 4 High-Converting Keyword Combinations Poor Google Ads results? Try These 4 High-Converting Keyword Combinations]() Poor Google Ads results? Try These 4 High-Converting Keyword CombinationsMaster the combination of Google Ads high conversion keywords, combined with LinkedIn marketing, TikTok operation and Facebook advertising, with the help of Yiyingbao AI tools to realize foreign trade marketing breakthroughs and improve ROI!
Poor Google Ads results? Try These 4 High-Converting Keyword CombinationsMaster the combination of Google Ads high conversion keywords, combined with LinkedIn marketing, TikTok operation and Facebook advertising, with the help of Yiyingbao AI tools to realize foreign trade marketing breakthroughs and improve ROI!![EYP experience sharing: 3 hidden features that increase efficiency by 50% EYP experience sharing: 3 hidden features that increase efficiency by 50%]() EYP experience sharing: 3 hidden features that increase efficiency by 50%YiYingBao use experience reveal: 3 big hidden features to improve LinkedIn marketing, TikTok operation and Google Ads efficiency 50% +, integrated multi-language website, Yandex promotion and data analysis tools, help foreign trade enterprises efficiently go to sea.
EYP experience sharing: 3 hidden features that increase efficiency by 50%YiYingBao use experience reveal: 3 big hidden features to improve LinkedIn marketing, TikTok operation and Google Ads efficiency 50% +, integrated multi-language website, Yandex promotion and data analysis tools, help foreign trade enterprises efficiently go to sea.![Is TikTok's overseas B2B operation viable? This business has already gained 200+ customers Is TikTok's overseas B2B operation viable? This business has already gained 200+ customers]() Is TikTok's overseas B2B operation viable? This business has already gained 200+ customersIs TikTok's overseas B2B operation feasible? Combining LinkedIn marketing, Facebook ads and multi-language websites, EYB helps enterprises gain 200+ customers, and verifies the new path of foreign trade marketing in practice.
Is TikTok's overseas B2B operation viable? This business has already gained 200+ customersIs TikTok's overseas B2B operation feasible? Combining LinkedIn marketing, Facebook ads and multi-language websites, EYB helps enterprises gain 200+ customers, and verifies the new path of foreign trade marketing in practice.![How to do overseas social media operations? Real-life examples dismantle the growth path How to do overseas social media operations? Real-life examples dismantle the growth path]() How to do overseas social media operations? Real-life examples dismantle the growth pathMaster LinkedIn marketing, TikTok operation and Facebook advertising practical skills, combined with EYB AI tools to realize multi-language website construction and data analysis, to help foreign trade enterprises grow efficiently, click to get the secrets of overseas social media operation!
How to do overseas social media operations? Real-life examples dismantle the growth pathMaster LinkedIn marketing, TikTok operation and Facebook advertising practical skills, combined with EYB AI tools to realize multi-language website construction and data analysis, to help foreign trade enterprises grow efficiently, click to get the secrets of overseas social media operation!![Is your independent website running slowly? Here's a 7-step guide to improving website speed. Is your independent website running slowly? Here's a 7-step guide to improving website speed.]() Is your independent website running slowly? Here's a 7-step guide to improving website speed.EasyCreation helps independent website operation with its 7-step practical guide to website speed optimization, specifically designed for B2B foreign trade and cross-border promotion. Combining data analytics tools to monitor TTFB/LCP, supplemented by global CDN, streamlined front-end resources, and integrated SEO+SEM marketing (Google Ads, Facebook Ads, LinkedIn, TikTok), it reduces customer acquisition costs and increases inquiry conversion rates within a limited budget. Apply now for a free diagnostic and speed-up solution, including practical KPIs and rollback strategies.
Is your independent website running slowly? Here's a 7-step guide to improving website speed.EasyCreation helps independent website operation with its 7-step practical guide to website speed optimization, specifically designed for B2B foreign trade and cross-border promotion. Combining data analytics tools to monitor TTFB/LCP, supplemented by global CDN, streamlined front-end resources, and integrated SEO+SEM marketing (Google Ads, Facebook Ads, LinkedIn, TikTok), it reduces customer acquisition costs and increases inquiry conversion rates within a limited budget. Apply now for a free diagnostic and speed-up solution, including practical KPIs and rollback strategies.

