








- China’s Ministry of Commerce Responds to Additional Charges on Low-Value Imports Imposed by the EUNov 06, 2026View details
- Two Internet Development Reports Released at the 2026 World Internet ConferenceNov 05, 2026View details
- Internet Business Revenue of Enterprises Above the Designated Size Reached RMB 1.716 Trillion in the First Three Quarters, with Profits Up 17.6%Nov 05, 2026View details
- Shopify's Third-Quarter Revenue and GMV Fall Short of Expectations, Sending Shares Tumbling Before the Market OpensNov 04, 2026View details
- Temu Sellers See a Decline in Traffic as the Platform’s Traffic Allocation ShiftsNov 04, 2026View details
- UK Regulator Requires E-Commerce Businesses to Clearly Display Total Prices Including Mandatory Delivery ChargesNov 04, 2026View details
How Can B2B Marketing Websites Overcome Slow Loading Speeds for Overseas Visitors?
What technical bottlenecks should be considered when building a B2B export marketing website? Overseas loading speed directly affects user experience and inquiry conversion. How should project managers investigate and optimize performance? The key is not to upgrade servers blindly, but to measure the real user experience in target markets, identify the main bottlenecks in the network, page resources, and third-party services, and address them in stages according to the budget.
First, determine where the slowdown is occurring
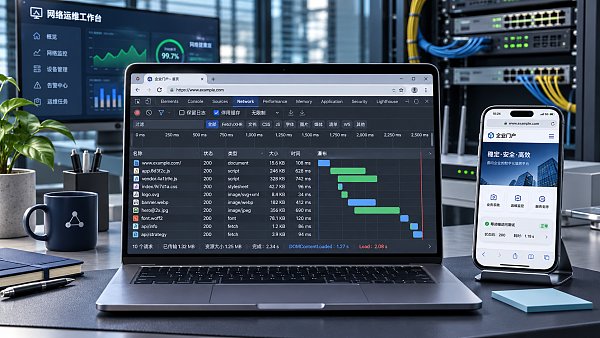
A website loading smoothly in China does not mean it will be fast for overseas customers. User location, cross-border network routes, server location, and mobile network quality all affect loading performance. Even with an overseas server, oversized images or too many scripts can leave customers waiting for a long time.
Project managers should first identify the main countries and regions they want to attract customers from, then test on both mobile and desktop devices. Test the homepage, key product pages, and advertising landing pages. Give priority to whether customers can see the main content quickly and use key features such as forms and navigation without problems.
It is advisable to combine real-user data with synthetic tests: the former reflects actual visitor experience, while the latter makes it easier to reproduce issues and identify resources causing them. If a new site has insufficient traffic, establish a baseline using testing tools in multiple regions, then continue validating performance as traffic builds.
Which metrics can show whether speed is affecting customer acquisition?
Use Core Web Vitals as a starting point: Largest Contentful Paint (LCP) reflects how quickly the main content loads, Interaction to Next Paint (INP) reflects interaction responsiveness, and Cumulative Layout Shift (CLS) reflects page stability. Together, these metrics affect how smoothly customers can browse and submit inquiries.
Good experience thresholds to use as a reference are: LCP of no more than 2.5 seconds, INP of no more than 200 milliseconds, and CLS of no more than 0.1. Real-user experience is typically assessed at the 75th percentile of visit samples, with mobile and desktop results evaluated separately. These figures are diagnostic targets, not a guarantee of higher conversion rates.
Project teams should also review time to first byte, total page requests, and failure rates across regions, and analyze these alongside inquiry form completion rates and advertising landing page conversion rates. Customer intent may differ across channels, so when comparing results before and after optimization, teams should minimize the impact of changes in traffic composition.
How should you investigate four common types of bottlenecks?
Type 1: Deployment location and network routes. If time to first byte is high across multiple overseas regions, check origin server response times, database queries, and cross-border network routes. Select suitable deployment regions based on where your main customers are located, and assess CDN coverage and origin-fetch performance in target markets.
A CDN is suitable for caching static resources such as images and stylesheets, and may also cache some pages depending on the business and configuration. However, inquiry submissions, login states, and personalized content require careful handling to prevent data from being served to the wrong users. Before signing a contract, ask the provider for details on node coverage in target regions and actual test results.
Type 2: Oversized images, videos, and fonts. Manufacturing websites often feature high-resolution product images and factory videos. Uploading original files directly can easily slow down mobile devices. Generate images at the sizes they will be displayed, use suitable compression formats, lazy-load below-the-fold resources, and provide video thumbnails.
The hero image is often the first content users focus on, so it should not always be lazy-loaded. During project acceptance, check image dimensions, image quality after compression, and how images display on mobile. Avoid compromising product details just to improve test scores or making it difficult for buyers to see key specifications.
Type 3: Scripts and third-party tools. Live chat, ad tracking, analytics code, and embedded videos can all increase the number of requests or even block page rendering. Use browser developer tools or performance reports to check the time taken by each item, remove plugins that serve no business purpose, and defer loading non-critical scripts.
Third-party tools should be assessed not only by their number, but also by whether they are available in target regions. If a live chat widget failing to load could affect inquiries, provide alternatives such as email or a form. After adjusting tracking code, also check that ad attribution and conversion events are still being recorded correctly.
Type 4: Website platform and dynamic features. Product filters, on-site search, language switching, and form interfaces can increase server and database load. If static resources have already been optimized but dynamic pages remain slow, check interface response times, caching strategies, and concurrency handling capacity.
How should you prioritize optimization when the budget is limited?
Start with pages that receive high traffic and directly affect customer acquisition: advertising landing pages, key product pages, and inquiry forms are usually a higher priority than low-traffic informational pages. Then create an actionable optimization list based on the regions affected, the number of users impacted, expected returns, and implementation difficulty.
In general, start by compressing large images, removing unused plugins, and fixing failed requests. Then assess CDN configuration, origin server migration, or changes to the system architecture. The former usually involve smaller changes; the latter involve costs, data migration, and business continuity, so they require testing and a rollback plan.
Return on investment should not be assessed solely by looking at the server bill. Project managers should also calculate website development, CDN traffic, third-party tool, and ongoing maintenance costs, and monitor loading experience and qualified inquiry trends in target regions after optimization. Do not assume that improved performance directly translates into more orders.
How should you assess and continuously monitor the overseas user experience?
Before acceptance testing, define the test regions, device types, network conditions, page list, and metric definitions, and record a pre-optimization baseline. After launch, retest under the same conditions, covering different browsers, multilingual pages, and mobile devices. Do not judge project completion based on a single speed test.
Functional acceptance is equally important: check product images, language switching, inquiry submissions, email notifications, analytics events, and ad tracking. When caching or migration is involved, also verify that form data is delivered correctly and that privacy and data processing meet applicable requirements in target markets.
After a website goes live, product images, marketing plugins, and advertising pages will continue to be added, and performance may deteriorate. Assign a monitoring owner, regularly review real-user metrics and conversion performance on key pages, retest after releases, and set alerts and response time limits for issues.
Summary: Make speed optimization part of customer acquisition project management
Overseas website speed is not solely a server issue; it results from the combined effects of networks, resources, code, and business functionality. Establish a baseline for target markets, identify bottlenecks on high-value pages, invest in stages, and retest to keep technical optimization aligned with inquiry generation goals.
When selecting a website development and marketing service provider, ask them to explain their testing methods for target regions, the scope of performance optimization, cost breakdown, and post-launch maintenance responsibilities. Yiyingbao provides services related to intelligent website development and overseas marketing. Specific deployment, optimization capabilities, and acceptance metrics should still be confirmed based on project requirements.
Related Articles
 How to Assess the Cost of a Website System for Export Businesses: A Breakdown of Website Development, Maintenance, and Promotion Costs
 How Can B2B Marketing Websites Overcome Slow Loading Speeds for Overseas Visitors?
 Can a global CDN improve cross-region access speeds for an independent website?


Related Products
 Yiyingbao SaaS Intelligent Website Building and Marketing SystemYiyingbao SaaS Intelligent Website Building and Marketing System, AI-powered no-code website building, rapid creation of multilingual B2B international websites in 10 minutes, global server acceleration, AI-powered SEO optimization, helping businesses connect efficiently with global markets. The perfect integration of technology and operation makes building an international trade website remarkably simple
 AI+SEM Intelligent Advertising Marketing SystemAI+SEM drives intelligent ad creation, empowering full-funnel precision advertising marketing. The system automatically generates weekly/monthly reports, AI recommends keywords and target countries, monitors core metrics in real-time with intelligent alerts, and enables one-click high-conversion ad solutions to help quickly acquire customers and improve ROI.
 AI+SEO Dual-Engine System Optimization ServicesYiyingbao’s AI+SEO dual-engine optimization system helps foreign trade enterprises acquire high-quality organic traffic through AI-powered keyword research, content generation, and comprehensive technical optimization, significantly improving search rankings and conversion rates.
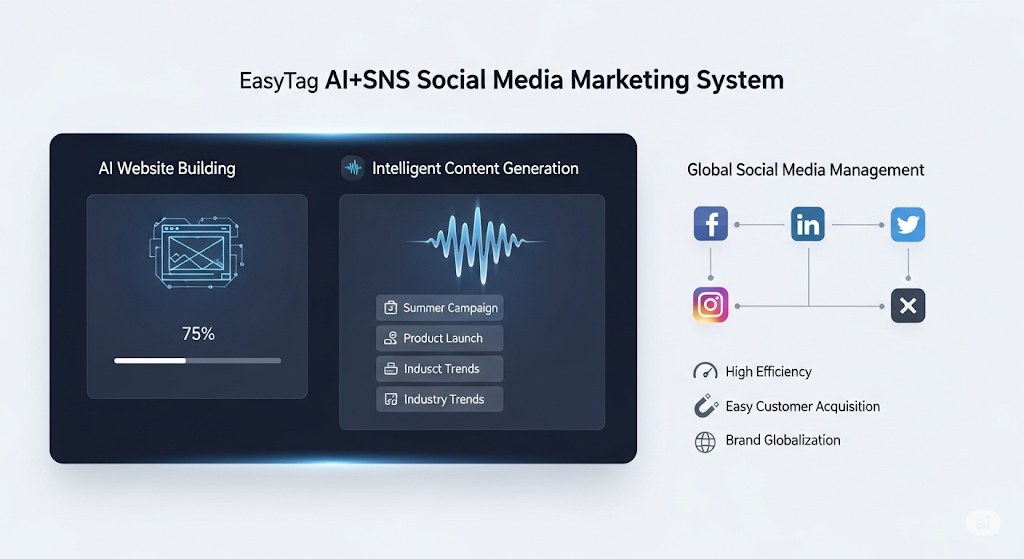
 AI+SNS Social Media Marketing SystemYingbao AI+SNS Social Media Marketing System - Precision social capture for the social media era. Supports one-click content synchronization across major platforms like Facebook and LinkedIn. AI intelligently rewrites posts for enhanced relevance. 24/7 AI customer service and user profiling analysis empower businesses to efficiently expand into global markets.
 AI+SEO营销解决方案易营宝AI+SEO营销解决方案,通过AI批量写作、智能生成TDK、精准关键词扩词等功能,全面优化网站SEO效果,提升流量与转化率。助力企业构建高效智能网站新生态。
 AI+SEM Advertising Marketing SolutionsAI+SEM Advertising Marketing Solution leverages AI technology to deeply empower SEM ad campaigns. It automatically generates weekly/monthly reports using AI, presenting account data across multiple dimensions for comprehensive insights into campaign performance and trends. The system precisely recommends keywords and target countries, intelligently generates high-conversion ad copy, and enables one-click activation of efficient campaign plans to help businesses rapidly acquire customers. Simultaneously, it monitors core metrics in real time, intelligently identifies abnormal fluctuations, and issues timely alerts to ensure stable, high-return advertising results.
 Domain Name ServicesEasyWin provides professional domain name services, including intelligent queries, one-stop registration, brand protection, and full lifecycle management, helping businesses build a digital brand image.
 EasyOperate B2C Cross-Border E-Commerce Platform & Independent WebsiteEasyStore B2C Cross-border E-commerce Independent Store is an intelligent website building and cross-border e-commerce integrated solution independently developed by EasyStore Information Technology (Beijing) Co., Ltd. The system is specially designed for small and medium-sized as well as large export enterprises, integrating 'website building, operation, marketing, advertising, and conversion' into one, helping enterprises quickly establish cross-border e-commerce independent stores to achieve brand globalization and global sales growth.
The platform supports multiple languages, multiple currencies, and multi-channel marketing, with built-in AI intelligent translation and SEO optimization systems, suitable for mainstream markets such as Southeast Asia, Europe and America, Latin America, and the Middle East, assisting Chinese manufacturing enterprises in efficiently deploying international e-commerce strategies. SSL证书易营宝提供专业SSL安全证书服务,包括单域名和泛域名证书,确保网站数据传输加密、身份验证和完整性保护,助力企业建立安全可信的在线业务环境。