








- What should you focus on in the latest enterprise SaaS report? From renewal rates and delivery costs to overseas growth opportunitiesJul 12, 2026View details
- What signals are worth paying attention to in a cross-border marketing trend report? B2B companies should look at these 6 signalsJul 11, 2026View details
- How to Read a Cross-Border Marketing Trends Report? Five Key Dimensions for Evaluating Channel OpportunitiesJul 11, 2026View details
- Which channel has the highest ROI in the global traffic ecosystem? Comparative analysis of search, social media, and advertisingJul 10, 2026View details
- What multilingual website services are available in Sanya? Which model is more suitable for local businesses going global?Jul 08, 2026View details
- How to view the complete list of China SaaS companies in the top 100? Practical methods for screening website-building and marketing service providersJul 08, 2026View details
What metrics should be included in a social media data monitoring report?
In social media operations, what is truly difficult is not publishing content, but deciding which actions are worth continuing to invest in. Many teams stare at likes, comments, and follower counts every day, yet struggle to answer a more critical question: whether this round of content publishing or ad placement has actually brought effective reach, genuine interest, and trackable leads. To solve this problem, you need a social media data monitoring report that can connect exposure, interaction, and conversion all the way to cost.
For website and marketing service integrated scenarios, a social media data monitoring report is not just an operations weekly report; it is also a decision-making tool that links content, advertising, landing pages, and sales leads. Especially in overseas customer acquisition, social media often serves only as the entry point, while subsequent conversions happen on the official website, independent site, forms, or store pages. Looking only at platform-level data often overestimates content popularity and underestimates conversion costs.
Why a report should look at business results from platform data

The core of a social media data monitoring report is not to pile up data, but to connect “what happened” with “why it happened.” After content is published, there is first exposure and reach, then interaction, clicks, visits, inquiries, and finally leads, orders, or retargeted audiences.
If the report only stays on the platform side, it is difficult to know whether high-interaction content truly brought high-quality visits. Conversely, some content with mediocre surface interaction may, because of precise audience targeting, bring lower lead costs. This is why more and more teams combine social media data monitoring reports with website analysis, advertising data, and form conversion data.
In overseas business, this linkage is even more important. Audience interaction habits, click tendencies, and lead cycles vary greatly across markets, and popularity on a single platform does not equal business value. Only by placing social media data and independent site conversion data in the same report can judgments avoid being misleading.
A social media data monitoring report should cover at least four layers of metrics
A practical social media data monitoring report is usually divided into four layers: exposure, interaction, traffic, and conversion. The advantage of this design is that when a problem appears, it can be located quickly, rather than seeing only the result without understanding the cause.
First look at the exposure layer: has the content been seen
Common exposure metrics include impressions, reach, follower coverage, organic exposure, and paid exposure share. Impressions reflect how many times the content appeared, while reach is closer to the number of people who actually saw it; the two should not be confused.
If impressions are high and reach is low, it usually means there is a lot of repeated exposure. If organic exposure remains low for a long time, it may mean the content match is insufficient, platform distribution is limited, or account activity and tagging need to be adjusted.
Then look at the interaction layer: has the content sparked interest
The most common interaction metrics are likes, comments, shares, saves, direct messages, and interaction rate. It is recommended to standardize the interaction rate formula, for example by dividing total interactions by reach, to avoid inconsistent methods across platforms and teams that make cross-comparisons meaningless.
What is more worth paying attention to is interaction structure. Shares and saves often better indicate content value than likes, while direct messages are closer to commercial interest. If comments are high but negative feedback is frequent, the report should also separately mark sentiment, rather than simply treating it as activity.
Then look at the traffic layer: has the interest entered the website
The traffic layer usually includes link click-through rate, landing page visits, visit depth, bounce rate, and dwell time. Only when the social media data monitoring report reaches this step can platform popularity be connected to website behavior.
For businesses using smart website building, independent sites, or multilingual official websites to acquire customers, landing page performance is especially critical. Even if content gets many clicks, slow page loading, overly long forms, or language mismatch can still cause front-end traffic to leak away here.
Finally look at the conversion layer: has it generated effective leads
The conversion layer should at least include form submissions, inquiries, add-to-cart or registration numbers, conversion rate, and single-lead cost. If conditions allow, you can also add valid lead rate, sales acceptance rate, and pre-close indicators.
Lead cost is often the metric many teams overlook most easily, yet it is the one that best reflects input-output efficiency. Especially when advertising and organic content run in parallel, looking only at traffic without cost often leads to a misjudgment of channel priority.
From interaction rate to lead cost, which metrics are worth tracking long term
Not every metric needs to be tracked every day. What truly has judgment value is a set of core metrics that can reflect trends, facilitate comparison, and guide action adjustments. The simplified template below is suitable for daily social media data monitoring reports.
If you want to further improve readability, you can break it down by content type, such as short videos, image posts, live replay, and ad creatives. This makes it easier to determine whether the platform mechanism affected the data or whether there is a problem with the content itself.
In website and marketing integrated scenarios, reports cannot only look at the social media backend
In actual business, the greatest value of a social media data monitoring report often appears after cross-system linkage. The platform backend can tell you who saw it and who clicked it, but the website side can tell you who stayed, who left, and who came closer to conversion.
This is also why website and marketing service integration is receiving more and more attention. Social media content, ad placement, landing page experience, SEO traffic, and retargeted audiences are all part of the same growth chain and are not suitable for separate management.
Taking a digital service platform like Yiyingbao, which covers smart website building, social media operations, ad placement, and SEO optimization, as an example, the value lies not only in execution, but in connecting front-end customer acquisition data with back-end conversion data. The result is that the report is no longer just review material, but can directly support budget allocation, page optimization, and content selection.
Especially when multilingual websites, overseas independent sites, and ad landing pages are running in parallel, if there is no unified data framework, the social media team, ad team, and website team can easily each view their own data, and in the end no one can clearly tell where the problem lies.
Common misconceptions are not about how many metrics there are, but about how they are judged
Many social media data monitoring reports look very full, but are not actually efficient in practice; the reason usually lies in the judgment logic.
- Only looking at absolute values, not trends. A single explosive hit cannot represent stable capability; continuous four-week changes are more meaningful.
- Only looking at platform data, not landing page conversion. High clicks with low conversions usually means the problem is on the website, not the content.
- Putting all platforms together for comparison. Different platforms have different distribution mechanisms; it is best to first compare within the same platform, then make cross-platform judgments.
- Ignoring customer acquisition cost. Follower growth may look great, but if lead cost keeps rising, the strategy needs to be adjusted.
- Lack of unified attribution. Without source tagging and conversion path records, the social media data monitoring report is hard to support decision-making.
Simply put, the report is not made for “looking complete,” but for “knowing what to change next.” A report that can guide action is the practical template.
To make the report truly useful, you can start with three actions
If you are preparing to optimize an existing social media data monitoring report, there is no need to make it overly complex all at once. Start by connecting the key actions, and the effect will usually become more obvious.
Unify the measurement criteria
First clarify the calculation methods for interaction rate, conversion rate, and lead cost. Only when the criteria are unified will cross-period comparisons be meaningful.
Connect the sources
Set clear source tags for different platforms, different ad groups, and different content themes, and link social clicks with website conversions.
Review by scenario
Review brand exposure, inquiry acquisition, and store conversion separately. Different goals correspond to different priorities in the social media data monitoring report.
When a report can reflect interaction quality, website handoff, and lead cost at the same time, the direction for content optimization, ad adjustment, and page revision becomes much clearer. The next step, instead of continuing to add more scattered metrics, is better spent checking whether the existing data already covers the full chain and whether it is sufficient to support judgment. The more mature social media operations become, the more they rely on a social media data monitoring report that is easy to understand and practical to use.
Related Articles
 What metrics should be included in a social media data monitoring report?
 How to solve the problem of an overly long overseas social media content production cycle? Topic selection, collaboration, and AI efficiency improvement solutions
 Social Media Traffic Generation Facebook: Where to Start? Homepage, Content, and Ad Synergy Methods



Related Products
 EasyCamp SaaS Smart Website Marketing SystemE-Yingbao SaaS Smart Website Marketing System: AI-powered, zero-code website building. Rapidly launch multilingual independent e-commerce sites in just 10 minutes. Global server acceleration and AI-driven SEO optimization empower businesses to efficiently connect with global markets. The seamless integration of technology and user-friendly operation makes building e-commerce sites incredibly simple.
 AI+SEM Intelligent Advertising Marketing SystemAI+SEM drives intelligent ad creation, empowering full-funnel precision advertising marketing. The system automatically generates weekly/monthly reports, AI recommends keywords and target countries, monitors core metrics in real-time with intelligent alerts, and enables one-click high-conversion ad solutions to help quickly acquire customers and improve ROI.
 AI+SEO Dual Engine Optimization ServiceEasyWin AI+SEO Dual Engine Optimization System leverages AI-powered keyword mining, content generation, and comprehensive technical optimization to help foreign trade enterprises acquire high-quality organic traffic, significantly improving search rankings and conversion rates.
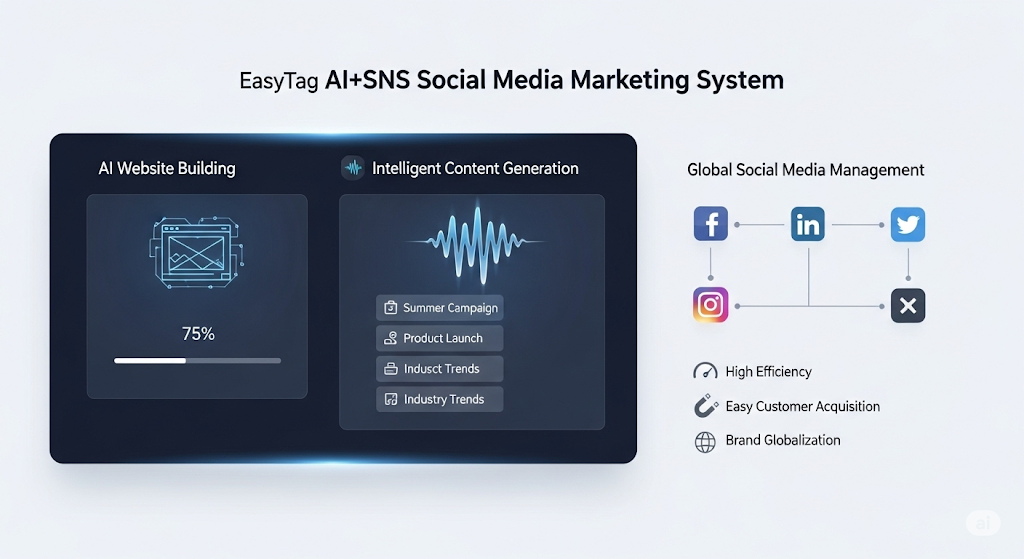
 AI+SNS Social Media Marketing SystemYingbao AI+SNS Social Media Marketing System - Precision social capture for the social media era. Supports one-click content synchronization across major platforms like Facebook and LinkedIn. AI intelligently rewrites posts for enhanced relevance. 24/7 AI customer service and user profiling analysis empower businesses to efficiently expand into global markets.
 AI+SEO营销解决方案易营宝AI+SEO营销解决方案,通过AI批量写作、智能生成TDK、精准关键词扩词等功能,全面优化网站SEO效果,提升流量与转化率。助力企业构建高效智能网站新生态。
 AI+SEM Advertising Marketing SolutionsAI+SEM Advertising Marketing Solution leverages AI technology to deeply empower SEM ad campaigns. It automatically generates weekly/monthly reports using AI, presenting account data across multiple dimensions for comprehensive insights into campaign performance and trends. The system precisely recommends keywords and target countries, intelligently generates high-conversion ad copy, and enables one-click activation of efficient campaign plans to help businesses rapidly acquire customers. Simultaneously, it monitors core metrics in real time, intelligently identifies abnormal fluctuations, and issues timely alerts to ensure stable, high-return advertising results.
 Domain Name ServicesEasyWin provides professional domain name services, including intelligent queries, one-stop registration, brand protection, and full lifecycle management, helping businesses build a digital brand image.
 EasyOperate B2C Cross-Border E-Commerce Platform & Independent WebsiteEasyStore B2C Cross-border E-commerce Independent Store is an intelligent website building and cross-border e-commerce integrated solution independently developed by EasyStore Information Technology (Beijing) Co., Ltd. The system is specially designed for small and medium-sized as well as large export enterprises, integrating 'website building, operation, marketing, advertising, and conversion' into one, helping enterprises quickly establish cross-border e-commerce independent stores to achieve brand globalization and global sales growth.
The platform supports multiple languages, multiple currencies, and multi-channel marketing, with built-in AI intelligent translation and SEO optimization systems, suitable for mainstream markets such as Southeast Asia, Europe and America, Latin America, and the Middle East, assisting Chinese manufacturing enterprises in efficiently deploying international e-commerce strategies. SSL证书易营宝提供专业SSL安全证书服务,包括单域名和泛域名证书,确保网站数据传输加密、身份验证和完整性保护,助力企业建立安全可信的在线业务环境。