








- CBP Finalizes Electronic Rail Export Manifest Rule, Effective October 26, 2026Oct 26, 2026View details
- Amazon’s 2026 peak season surcharge takes effect on October 25Oct 26, 2026View details
- AI Is Eating SaaS: Three Real-World Cases in One AfternoonOct 25, 2026View details
- Exiger CEO: The SaaS Apocalypse Is Real, but It Means Something DifferentOct 25, 2026View details
- Hengqin Cooperation Zone Shares Cross-Border E-Commerce Developments, Focusing on Macao-Hengqin Collaboration and International MarketsOct 24, 2026View details
- A Shenyang study highlights the development of the “cross-border e-commerce + industrial cluster” modelOct 24, 2026View details
How should you set monitoring thresholds and optimization priorities when an advertising account experiences unusual fluctuations?
When checking the ad dashboard in the morning, you notice that spend is rising faster than usual, but inquiries have not increased. The easiest response is to lower the budget or change bids. But if the website form has stopped working, adjusting bids will only make troubleshooting more confusing. Effective advertising monitoring and optimization is not about setting more alerts; it is about using thresholds to identify genuine anomalies and prioritizing responses according to their business impact.
First, check: Is the fluctuation in the ad delivery, data, or website?
When conversions drop sharply, do not immediately conclude that the ads are no longer working. Check each step in the “ad impressions—clicks—landing page visits—form submissions or orders—qualified inquiries or sales” journey. This is usually faster than repeatedly switching between reports.
- Unusual spend: Check the budget, bidding strategy, ad schedule, and recent change history to see whether anyone has adjusted the settings.
- Clicks are normal, but visits are down: Check page loading, redirects, mobile compatibility, and whether the target market can access the site normally.
- Visits are normal, but conversions are down: Test the forms, payments, and event tracking, and verify the actual records in your customer management system.
Also make sure the account time zone, currency, and attribution window are consistent. Google Ads and Facebook Ads may both attribute the same order, and platform conversions may be reported with a delay. Do not compare data for the current day, which may not yet be fully reported, directly with historical data that has already been fully recorded.
Monitoring thresholds need a baseline and trigger conditions
“Alert when costs rise by 20%” is only a starting point. New, stable, and promotional accounts have different ranges of fluctuation, so thresholds should be based on historical performance under comparable conditions. One approach is to use the same days of the week and time periods from the past four weeks as a reference, excluding periods when ads were paused, tracking failures, and special campaign days. For accounts with larger fluctuations, using the median can reduce the influence of outliers.
Deviation=(current value-baseline value)÷baseline value. For cost metrics, watch for increases; for conversion rate and return on ad spend, watch for decreases. When the baseline is zero or there is too little data, percentage calculations are not appropriate. Use absolute spend, event counts, and manual checks instead.
The following examples provide a starting point and are not industry standards for every account:
Each rule should ideally include the deviation, minimum sample size, and duration. For example, an account that normally receives only two or three B2B inquiries per day may show significant fluctuation when it loses just one inquiry. It is better to monitor the cost per qualified inquiry over a rolling period of several days. A cross-border online store with higher order volumes can use a shorter window, while still accounting for refunds, cancellations, and attribution delays.
When several alerts appear at once, which should you handle first?
Optimization priorities should not be ranked by “which metric is redder.” Instead, consider three questions: How much money could be lost if the issue is left unresolved? How much of the business is affected? Is there enough evidence to justify taking action?
P0: A break in the business process. If the website is inaccessible, forms cannot be submitted, or checkout fails, address the issue first. Retest to confirm it, then pause or limit the relevant ads depending on the scope of the impact, so you do not continue paying for traffic the business cannot handle.
P1: High spend and continued deterioration. When a high-spend campaign continues to exceed its cost target and qualified inquiries or orders are not keeping pace, investigate it as a priority. Rule out tracking issues first, then decide whether to exclude low-quality traffic, adjust the budget, or change the landing page.
P2: A localized decline in efficiency. A drop in click-through rate for a low-spend creative or a short-term cost increase in a small region can be placed in the monitoring queue. As long as the overall business objective is not significantly affected, there is no need to interrupt more important investigations.

Pay particular attention to accounts where “costs appear normal.” If the number of inquiries reported by the platform is stable but the sales team says many contacts are invalid, the issue is still serious. B2B businesses should include the qualified inquiry rate in their assessment, while B2C businesses should also consider gross margin, refunds, and fulfillment costs. Do not focus solely on the platform’s reported return on ad spend.
When making optimizations, allow time to observe the results
If you change the budget, audience, creative, and landing page all at once, even if results improve, it will be difficult to tell which change worked. A more reliable approach is to record the “anomaly—hypothesis—action—observation window—result” and make necessary adjustments around one primary hypothesis.
For example, if you suspect traffic quality has declined in a particular region, first compare that region’s qualified inquiry rate, device distribution, and page performance instead of reworking all the creatives. The observation window should cover the normal conversion reporting cycle. When using automated bidding, also account for the impact of the strategy’s learning phase and avoid making repeated changes over a short period.
Alerts also need to be “de-noised”: combine notifications when the same issue triggers multiple metric anomalies, and clear the alert once the issue is resolved. Automated rules are better suited to sending notifications, flagging anomalies, or applying pre-validated spending limits. If ads are to be paused automatically, permissions, logging, and recovery conditions should be in place.
Review advertising, website, and business results together
For businesses using 易营宝 website building and overseas marketing services, monitoring should connect ad spend, website events, and qualified leads rather than focusing solely on ad reports. Review false positives, missed alerts, and outcomes each week, and reset baselines promptly after peak seasons, website redesigns, or changes to target costs.
When coordinating budgets, the operations and finance teams should also align their definitions of “platform conversions” and “business returns.” For team development, you can also refer to Reshaping the Core Competencies of Corporate Finance Professionals in the Age of Artificial Intelligence, but account decisions should still be based on verifiable spend, lead quality, and sales data.
A useful monitoring system does not keep operators chasing alerts all day. When intervention is genuinely needed, it clearly identifies what went wrong, what to address first, and how to determine whether the adjustment was effective.
Related Articles
 For a small ad budget, should you choose Yiyingbao AI Ads or manage campaigns manually?
 Is it better to pay for overseas search marketing services per click or by the month?
 Multiple Amazon Peak-Season Fees Are Rising, Putting Pressure on Seller Profit Margins



Related Products
 Yiyingbao SaaS Intelligent Website Building and Marketing SystemYiyingbao SaaS Intelligent Website Building and Marketing System, AI-powered no-code website building, rapid creation of multilingual B2B international websites in 10 minutes, global server acceleration, AI-powered SEO optimization, helping businesses connect efficiently with global markets. The perfect integration of technology and operation makes building an international trade website remarkably simple
 AI+SEM Intelligent Advertising Marketing SystemAI+SEM drives intelligent ad creation, empowering full-funnel precision advertising marketing. The system automatically generates weekly/monthly reports, AI recommends keywords and target countries, monitors core metrics in real-time with intelligent alerts, and enables one-click high-conversion ad solutions to help quickly acquire customers and improve ROI.
 AI+SEO Dual-Engine System Optimization ServicesYiyingbao’s AI+SEO dual-engine optimization system helps foreign trade enterprises acquire high-quality organic traffic through AI-powered keyword research, content generation, and comprehensive technical optimization, significantly improving search rankings and conversion rates.
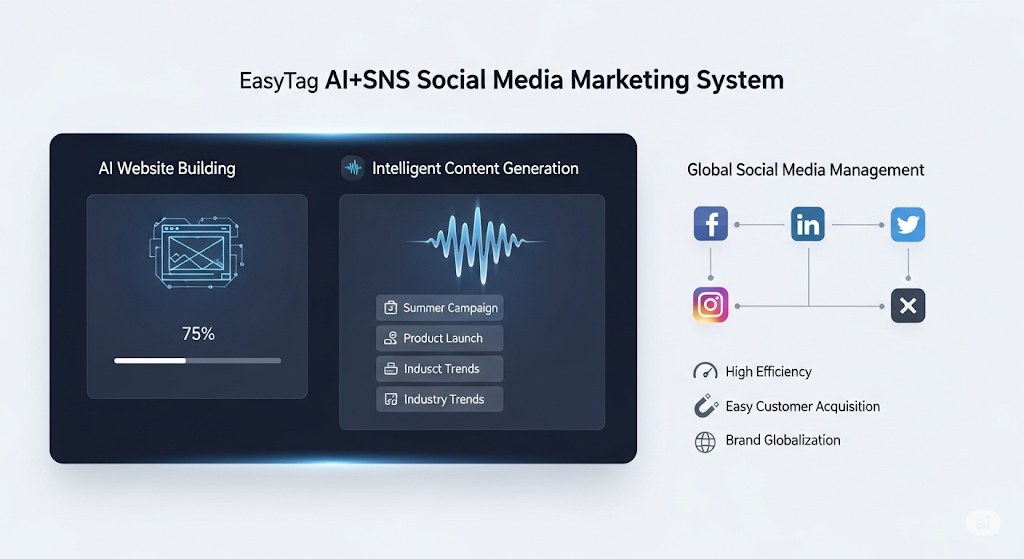
 AI+SNS Social Media Marketing SystemYingbao AI+SNS Social Media Marketing System - Precision social capture for the social media era. Supports one-click content synchronization across major platforms like Facebook and LinkedIn. AI intelligently rewrites posts for enhanced relevance. 24/7 AI customer service and user profiling analysis empower businesses to efficiently expand into global markets.
 AI+SEO营销解决方案易营宝AI+SEO营销解决方案,通过AI批量写作、智能生成TDK、精准关键词扩词等功能,全面优化网站SEO效果,提升流量与转化率。助力企业构建高效智能网站新生态。
 AI+SEM Advertising Marketing SolutionsAI+SEM Advertising Marketing Solution leverages AI technology to deeply empower SEM ad campaigns. It automatically generates weekly/monthly reports using AI, presenting account data across multiple dimensions for comprehensive insights into campaign performance and trends. The system precisely recommends keywords and target countries, intelligently generates high-conversion ad copy, and enables one-click activation of efficient campaign plans to help businesses rapidly acquire customers. Simultaneously, it monitors core metrics in real time, intelligently identifies abnormal fluctuations, and issues timely alerts to ensure stable, high-return advertising results.
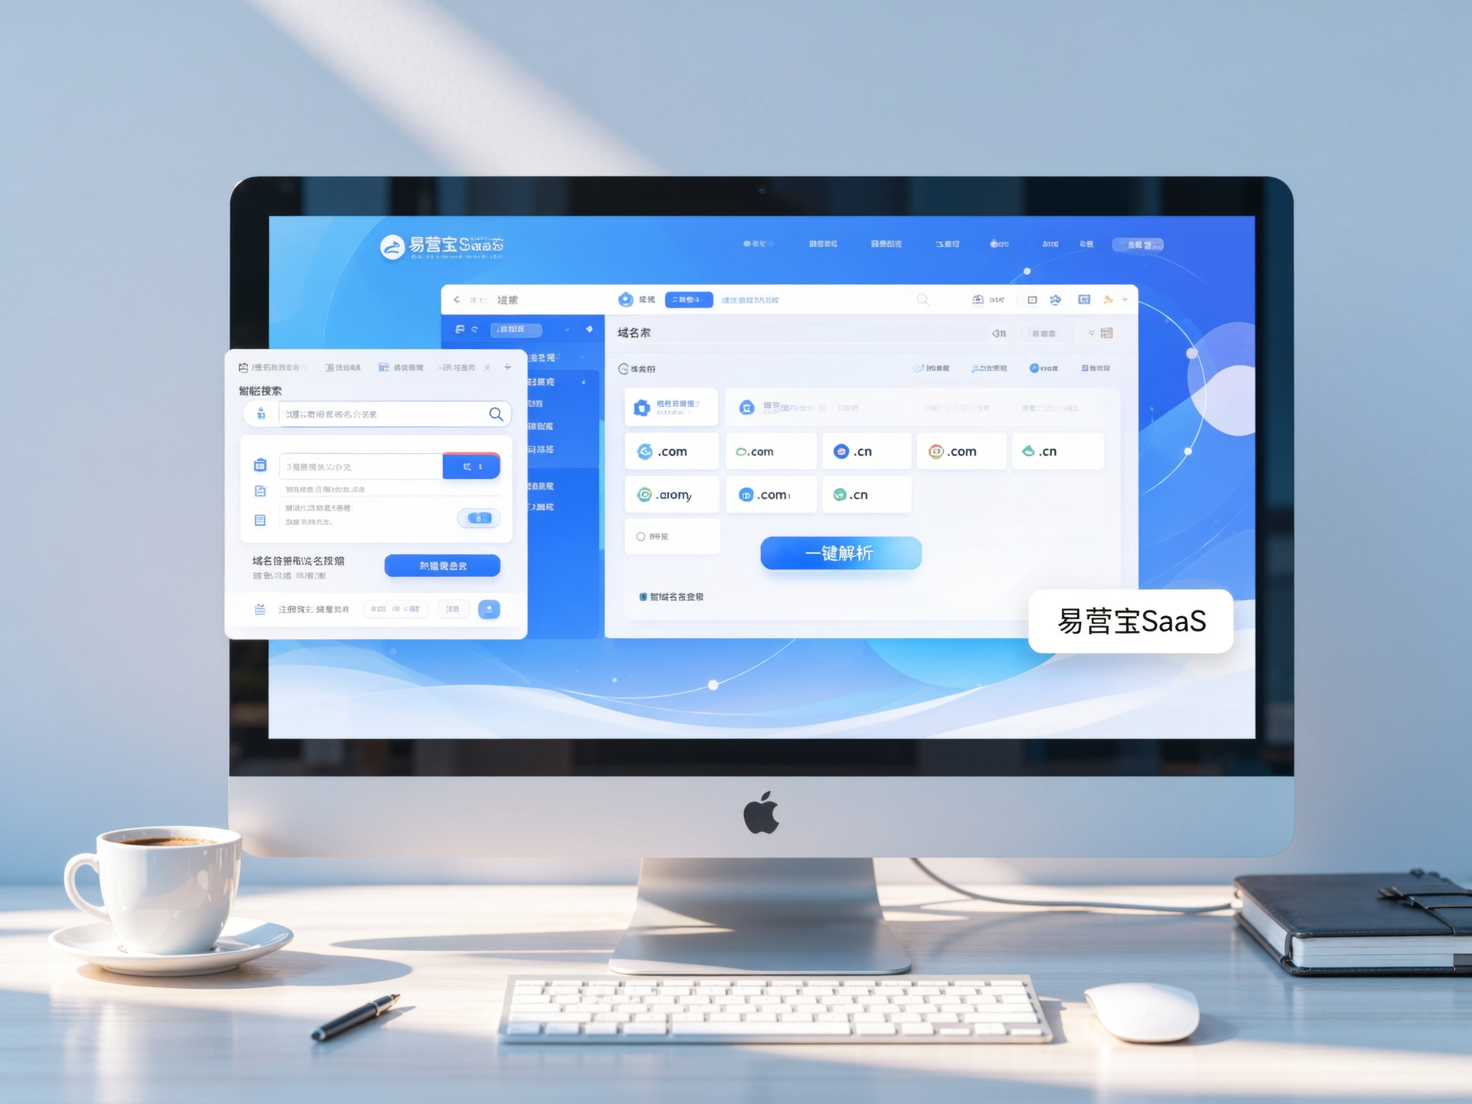
 Domain Name ServicesEasyWin provides professional domain name services, including intelligent queries, one-stop registration, brand protection, and full lifecycle management, helping businesses build a digital brand image.
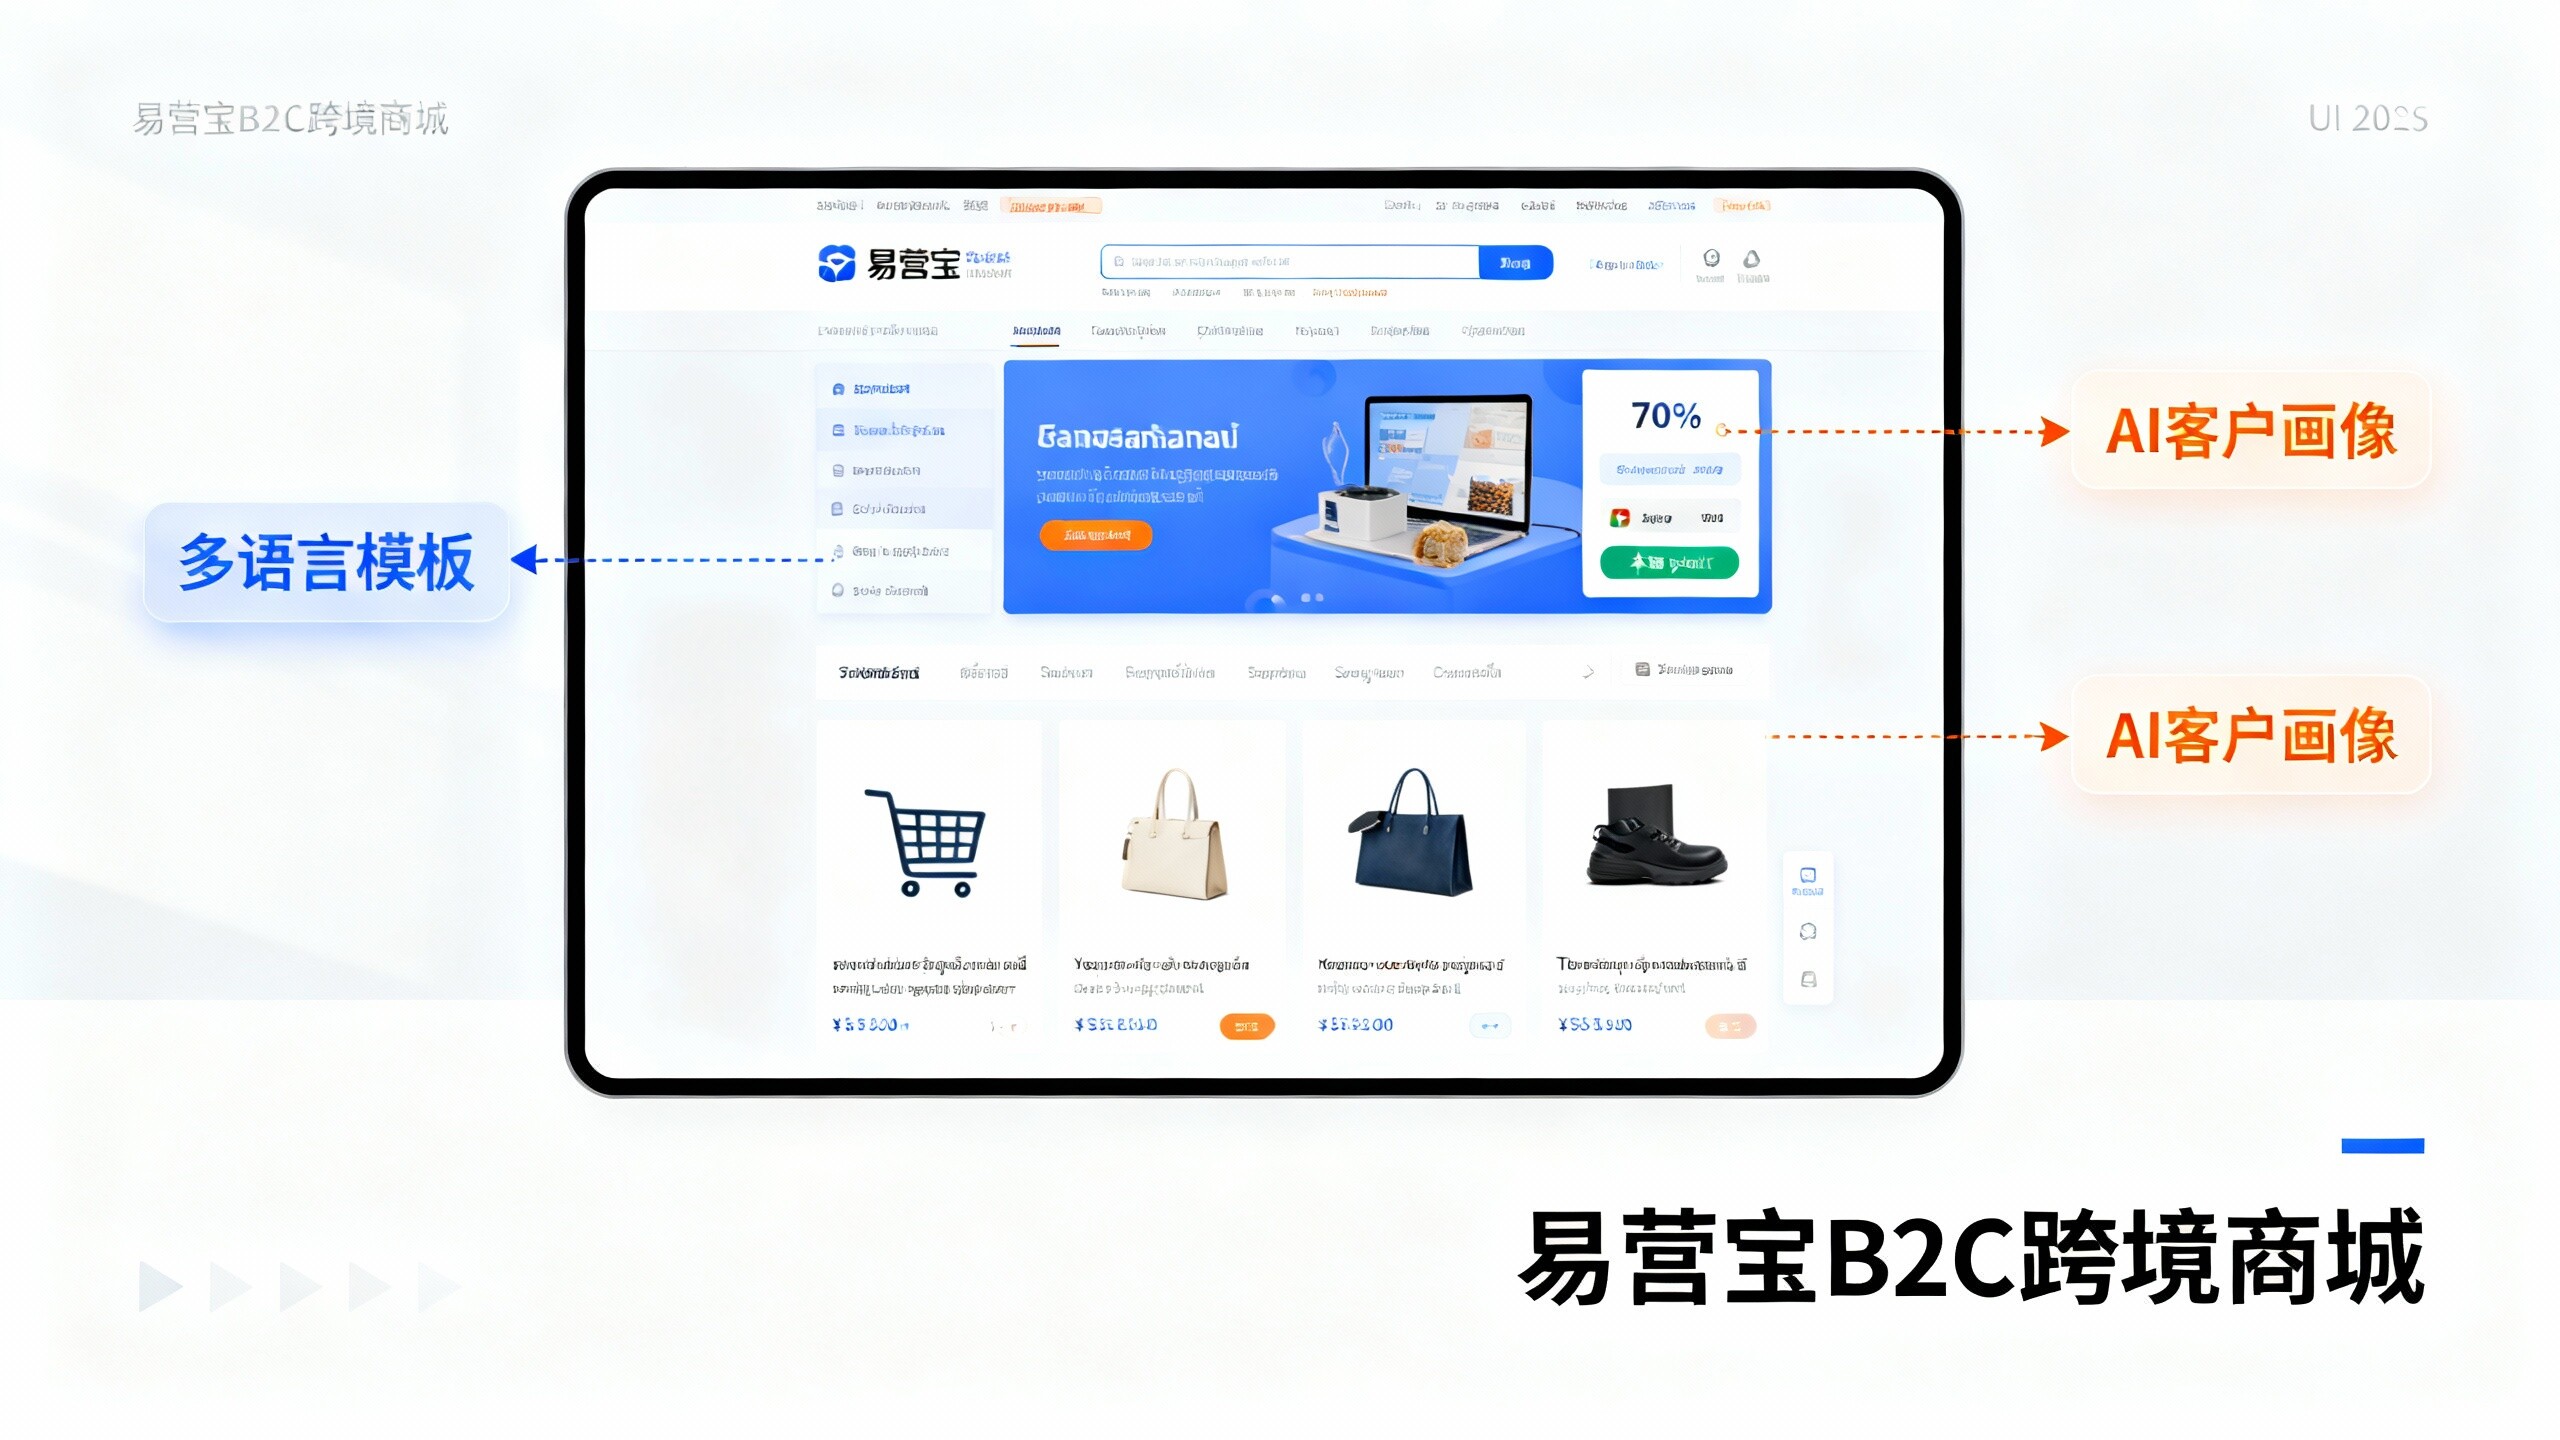
 EasyOperate B2C Cross-Border E-Commerce Platform & Independent WebsiteEasyStore B2C Cross-border E-commerce Independent Store is an intelligent website building and cross-border e-commerce integrated solution independently developed by EasyStore Information Technology (Beijing) Co., Ltd. The system is specially designed for small and medium-sized as well as large export enterprises, integrating 'website building, operation, marketing, advertising, and conversion' into one, helping enterprises quickly establish cross-border e-commerce independent stores to achieve brand globalization and global sales growth.
The platform supports multiple languages, multiple currencies, and multi-channel marketing, with built-in AI intelligent translation and SEO optimization systems, suitable for mainstream markets such as Southeast Asia, Europe and America, Latin America, and the Middle East, assisting Chinese manufacturing enterprises in efficiently deploying international e-commerce strategies. SSL证书易营宝提供专业SSL安全证书服务,包括单域名和泛域名证书,确保网站数据传输加密、身份验证和完整性保护,助力企业建立安全可信的在线业务环境。