








Introduction: Whether a multi-platform distribution data dashboard can truly guide growth depends on standardized attribution rules. Corporate decision-makers need to connect website, advertising, social media, and AI search data to accurately identify channel value and optimize budget allocation and global customer acquisition efficiency.
First Clarify: Unified Attribution Is Not About Creating a “Data Dashboard”

When businesses search for multi-platform distribution data dashboards, they are usually not looking to increase the number of reports. Instead, they want to answer a business question: with a limited marketing budget, which markets, channels, content, and landing pages should continue receiving investment?
A truly valuable data dashboard should not only display impressions, clicks, and follower growth. It should also place Google Ads, SEO, Facebook, short videos, email, AI search, and website conversions within the same decision-making framework.
If attribution rules are not standardized, the advertising team will use lead volume to demonstrate value, the content team will use organic traffic to demonstrate value, while the sales team will believe that “the customers who truly matter have not been recorded.” The more data management sees, the harder decision-making becomes.
Therefore, the core of a multi-platform distribution data dashboard is not visualization, but establishing an actionable set of rules: what counts as an effective touchpoint, what counts as a marketing-qualified lead, which channel should receive conversion credit, and how return on investment should be calculated.
Corporate Decision-Makers Should Primarily Standardize Four Key Definitions
The first is the traffic source definition. Naming rules for organic search, paid search, organic social traffic, social media ads, referral traffic, direct visits, and AI search traffic must be standardized to prevent the same channel from being categorized as multiple sources across different systems.
For example, Google Ads, Google organic search, and Google Discover should not simply be categorized as “Google traffic.” They correspond to different customer acquisition costs, growth cycles, and optimization methods, and combining them in reporting will directly mislead budget decisions.
The second is the conversion event definition. B2B companies should not treat every form submission as a valid inquiry. They should distinguish among content downloads, subscriptions, online consultations, meeting bookings, quote requests, and high-intent opportunities, while defining the business value of each.
For cross-border online stores, conversions should also cover add-to-cart, initiated checkout, successful payment, repeat purchases, and refunds. Attributing performance solely by order value can easily overlook channels with high return rates or low-quality growth generated only through substantial discounts.
The third is the customer identity definition. A user may first browse content through social media, then visit the official website through search, and finally be followed up by sales via WhatsApp, email, or CRM. Without a unified user ID or lead number, the customer journey will be disconnected.
The fourth is the cost and revenue definition. Advertising costs, content production, social media operations, technical tools, labor input, and agency service fees should all be included in the dashboard according to a unified period. Otherwise, calculating only media spend will overestimate the actual ROI of some channels.
The Choice of Attribution Model Depends on the Decision the Business Needs to Make
No single attribution model is suitable for every business. Management should first determine the decision objective served by the dashboard: controlling customer acquisition costs, identifying new growth opportunities, increasing the share of high-value customers, or validating the long-term contribution of branding and content.
First-touch attribution is suitable for evaluating the customer acquisition capabilities of new markets and new channels. It helps businesses determine whether customers initially discovered the brand through SEO articles, Google Ads, LinkedIn content, or AI search recommendations.
Last-touch attribution is suitable for optimizing short-term conversion efficiency. It can identify the pages, ads, or remarketing campaigns that last drove users to act before conversion, but it can easily overestimate the contribution of branded keywords, remarketing, and direct visits.
Multi-touch attribution is more suitable for export-oriented B2B businesses with long decision-making journeys. Linear, time-decay, or rules-based models can be used to assign reasonable weights to initial acquisition, mid-funnel nurturing, and final conversion respectively.
For businesses whose marketing data foundation is not yet complete, there is no need to pursue complex algorithms from the start. Establishing records for “first source, most recent source, key interaction, and final conversion” can usually resolve most disputes over budget allocation.
When Building a Multi-Platform Distribution Data Dashboard, Resolve Data Breakpoints First
The first step is to standardize tracking parameters. All ad links, social media content, email campaigns, partner media, and short-video traffic-driving links should use standardized UTM naming. Sources, mediums, campaigns, markets, and content topics must be traceable.
The second step is to standardize conversion tracking. Website forms, online chat, click-to-call actions, WhatsApp inquiries, sample requests, and store orders should be synchronized with analytics tools and CRM systems, preventing data from being available on the website side while no lead records exist on the sales side.
The third step is to connect marketing and sales statuses. The dashboard should not stop at “how many forms were obtained.” It must also track whether leads were contacted, whether they fit the target customer profile, whether they entered quotation, whether deals were closed, and the actual payment amount received.
The fourth step is to segment data by market, language, and product line. Advertising approaches for North America, Europe, the Middle East, and Southeast Asia differ significantly, and the search terms, conversion rates, and average order values of multilingual websites should not be compared as a single combined group.
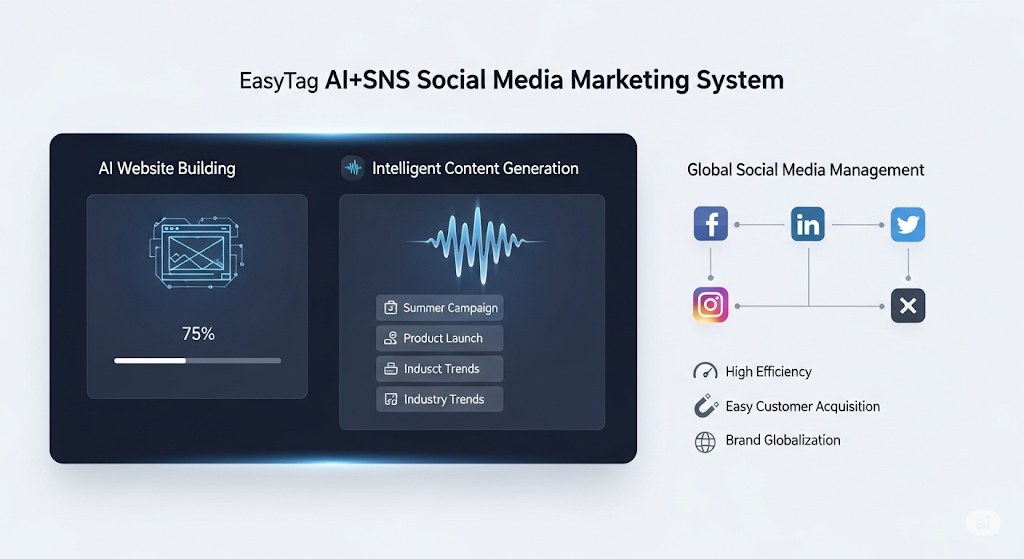
For integrated service scenarios such as Yiyingbao, which cover intelligent website building, SEO, advertising, and social media operations, it is especially necessary to predefine the data structure during the website-building stage. Adding tracking later often results in missing historical data and inconsistent channel naming.
Which Metrics Should Management Dashboards Focus On?
Decision-maker pages should be limited to a small number of core metrics, including total marketing investment, number of valid leads, qualified lead rate, customer acquisition cost, opportunity value, closed revenue, payment collection cycle, and channel ROI, rather than listing large volumes of raw platform metrics.
Among these, cost per valid lead offers more decision-making value than click cost alone. A channel with inexpensive clicks but poor inquiry quality may continuously consume sales resources; a channel with more expensive clicks but a high customer match rate may instead deserve greater investment.
The dashboard should also show the “incremental value” of channels. For example, SEO and content marketing may not directly generate the most closed deals in a given month, but they can reduce long-term customer acquisition costs and continuously provide a foundation for branded keyword searches, remarketing conversions, and AI search citations.
It is recommended to organize data into five levels: business overview, channel comparison, market comparison, content and landing pages, and sales funnel. Management monitors trends and anomalies, marketing leaders review channels and campaigns, and execution teams then drill down into creatives and keywords.
Avoid Three Common Misjudgments to Make Data Truly Support Growth
The first misjudgment is adding platform backend data directly together. Different platforms may count the same user repeatedly and may also use different attribution windows. A unified dashboard should be based on website analytics, CRM, and order data, rather than simply aggregating backend reports.
The second misjudgment is dismissing long-term channels based on short-term sales. SEO, social media content, brand communication, and GEO generative engine optimization generally require accumulation, but phased validation metrics should be established, such as high-quality visits, time spent on target pages, and growth in qualified inquiries.
The third misjudgment is looking only at averages. A channel with average overall ROI does not mean it should be stopped immediately; after further breaking down data by country, device, language, product, and audience, a particular segment may reveal clear growth potential.
When channel attribution is disputed, the most effective solution is not to repeatedly discuss “who deserves the credit,” but to standardize definitions, retain multiple views, and validate incremental impact through budget experiments, allowing data to become the basis for the next round of investment.
Conclusion: Only Unified Definitions Can Turn Distribution Data into Business Decisions
The value of a multi-platform distribution data dashboard does not lie in placing website, advertising, social media, and AI search data on the same page. It lies in enabling different teams to work collaboratively around the same set of rules for leads, costs, revenue, and attribution.
For corporate decision-makers, priority should be given to establishing traceable channel naming, verifiable conversion events, and data pathways that connect to sales results. Only then can attribution models be gradually optimized to more accurately identify sources of growth and improve the efficiency of global marketing budgets.